Rate Changes detected by USGS strainmeters
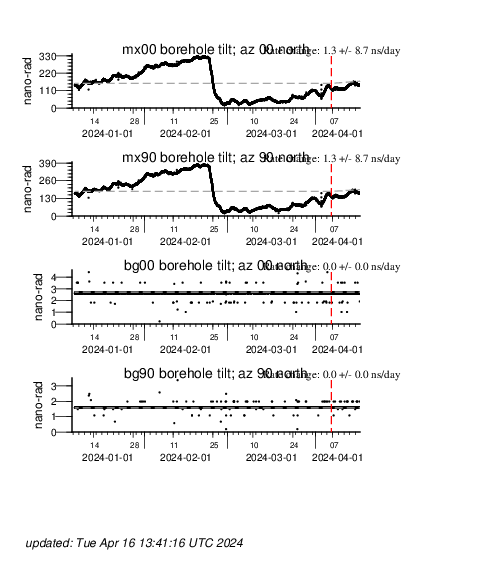
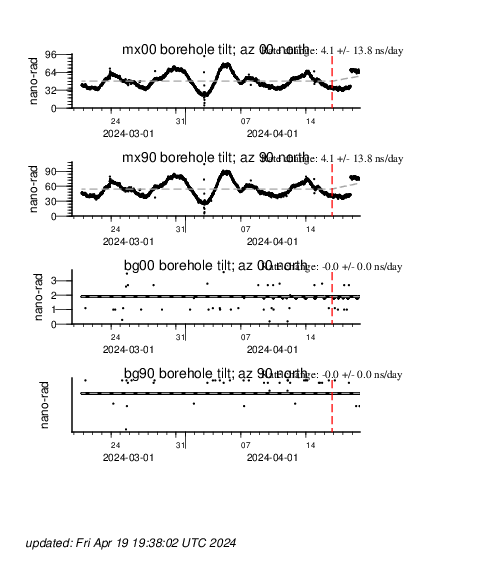
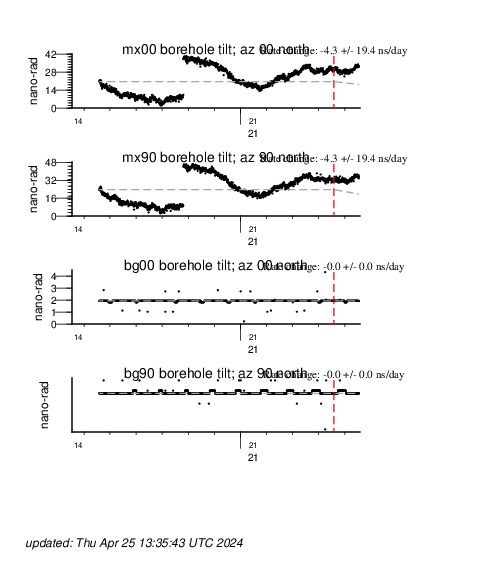
This page contains links to plots of strain data from the USGS borehole strainmeter network. The plots presented below explore rate changes in these data. Specifically, a period of data is selected for the previous 100 days, previous 30 days, and previous 10 days; a rate is fit to the all of the data in those time intervals and, for the last 10% of the time series (10 days, 3 days, and 1 day) a rate change is also fit. The estimated rate change is compared with its standard error. The plots are updated once per day through automated scripts.
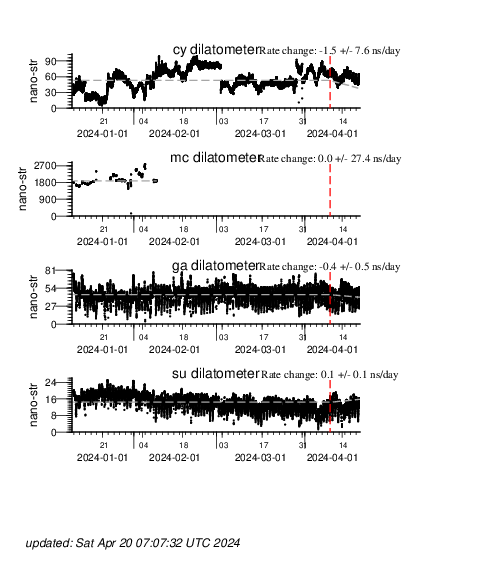
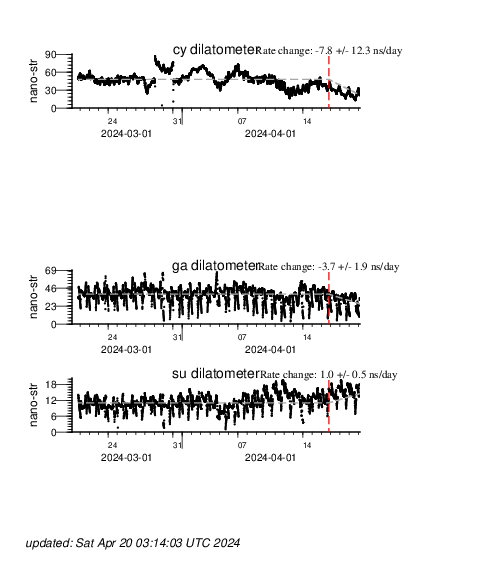
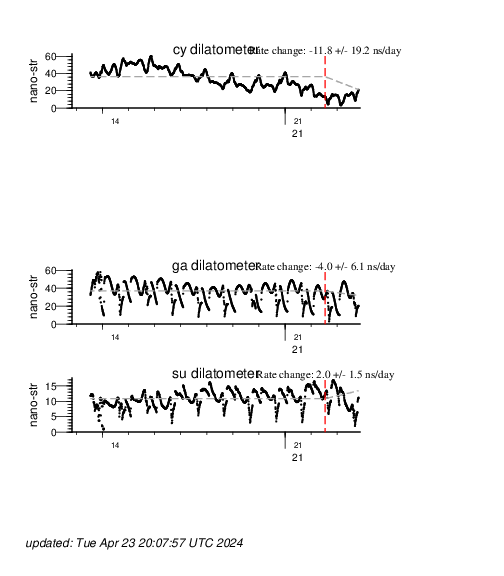
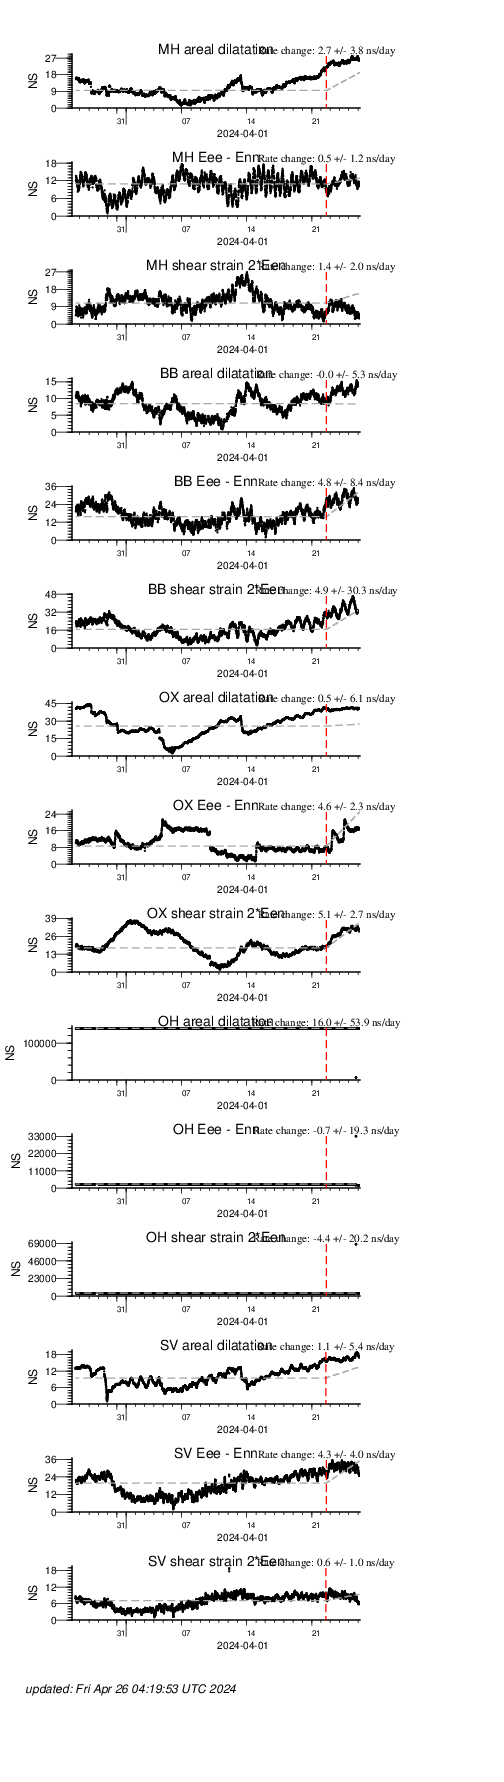
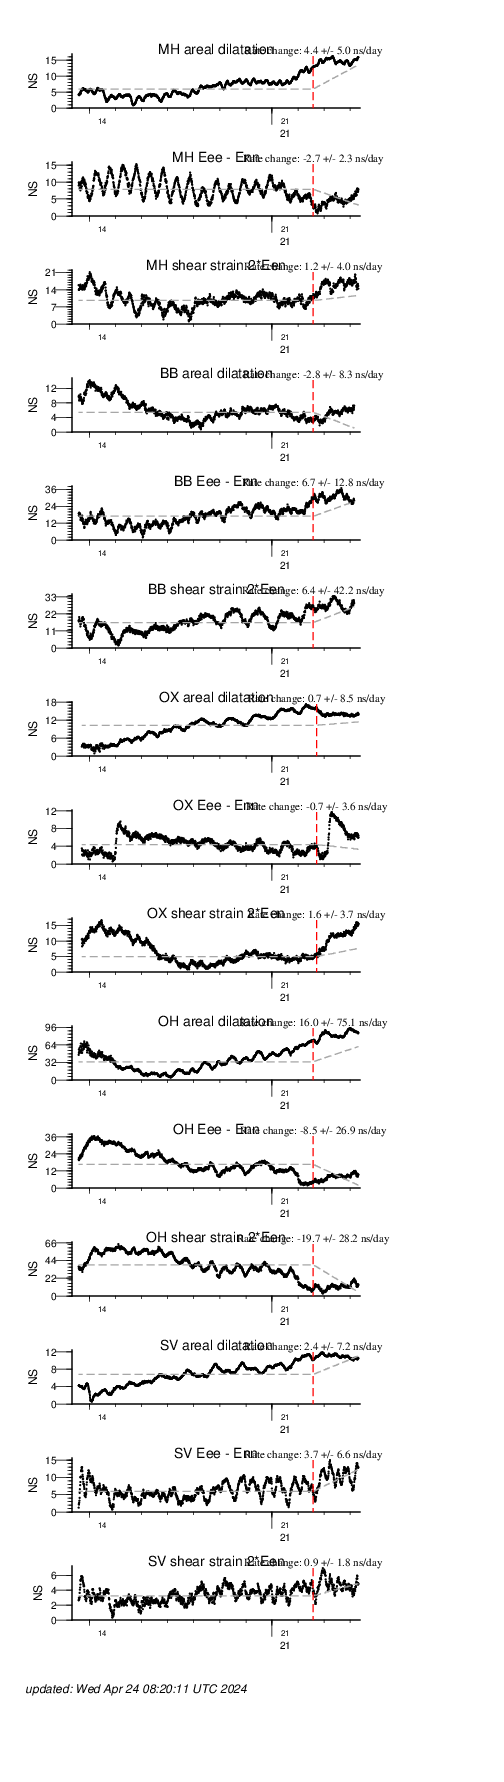
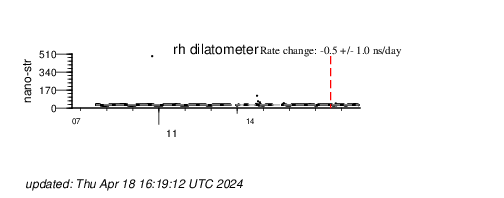
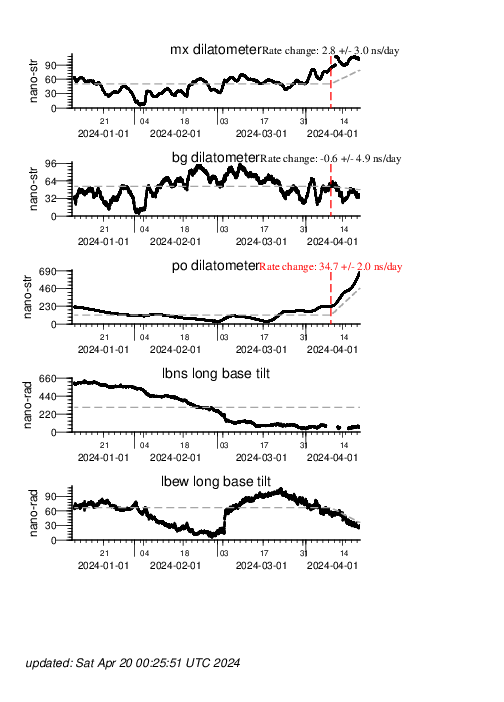
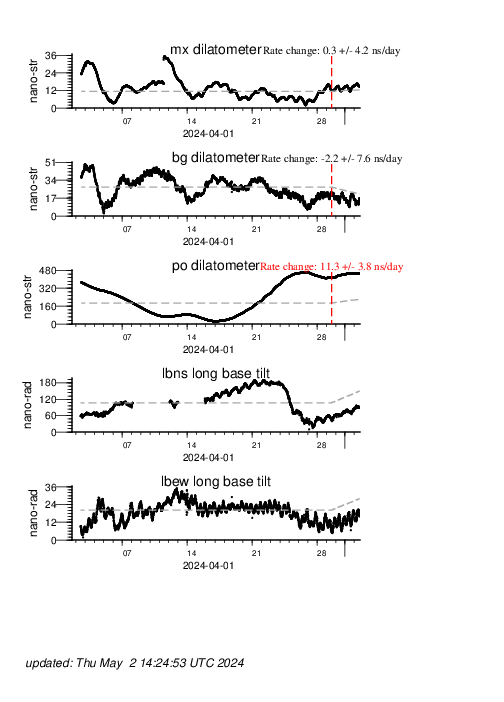
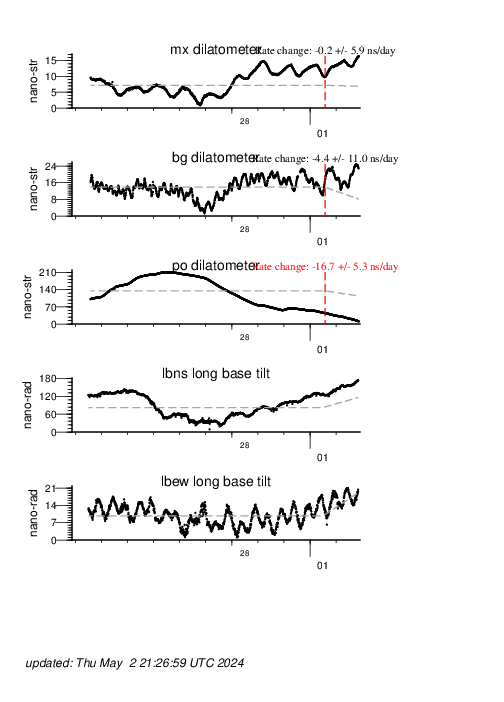
The first group are sorted by network and provides a quick summary of only the dilatometer data available for that network for the three intervals of time. These plot show the strain changes after adjusting the raw data for changes in the atmospheric pressure and removing the signal from the earth tide.
| Region | Dilatometer Stack Plots | ||
|---|---|---|---|
| last 100 days | last 30 days | last 10 days | |
| San Francisco Bay | 100 days | 30 days | 10 days |
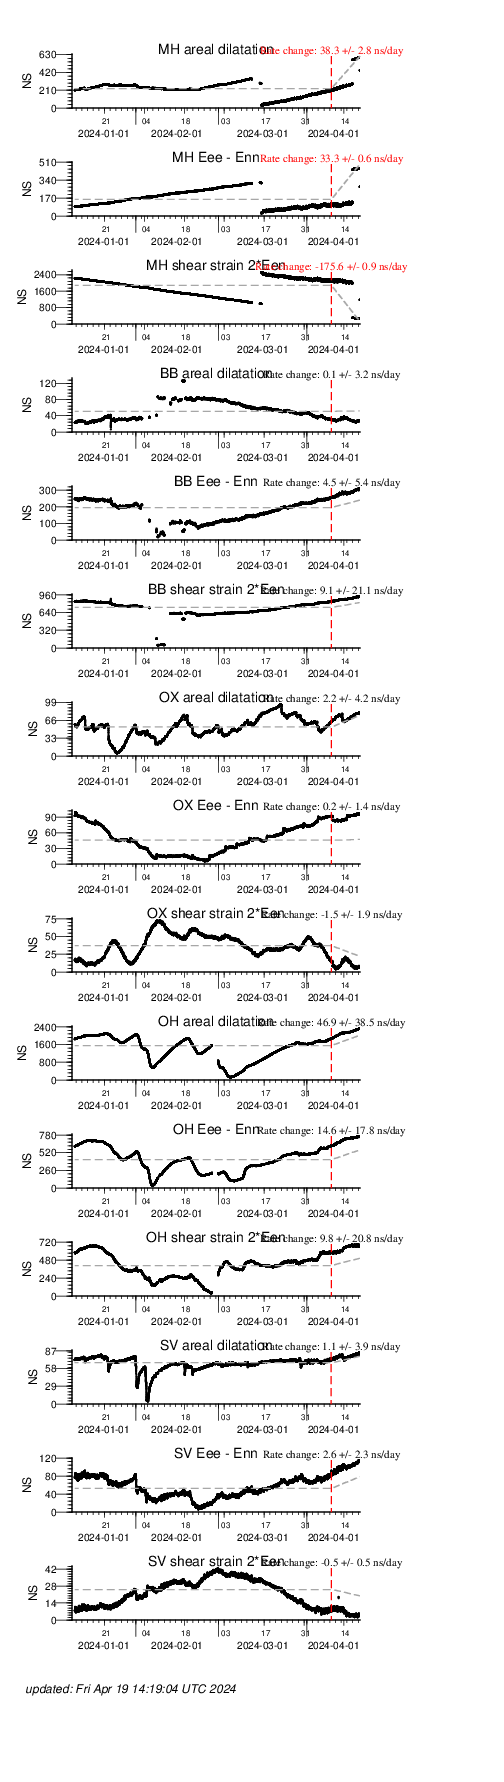
| San Francisco Bay -- Tensor strainmeters | 100 days | 30 days | 10 days |
| Parkfield | 100 days | 30 days | 10 days |
| Long Valley Strain | 100 days | 30 days | 10 days |
| Long Valley Tilt | 100 days | 30 days | 10 days |
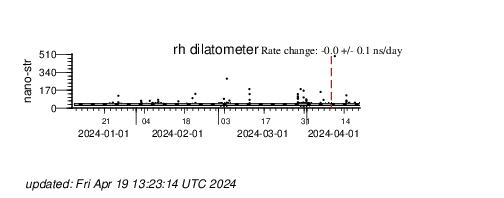
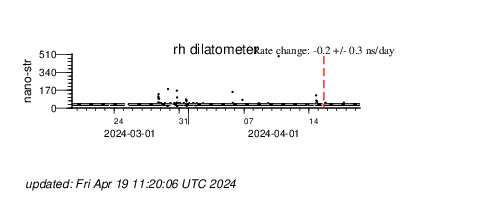
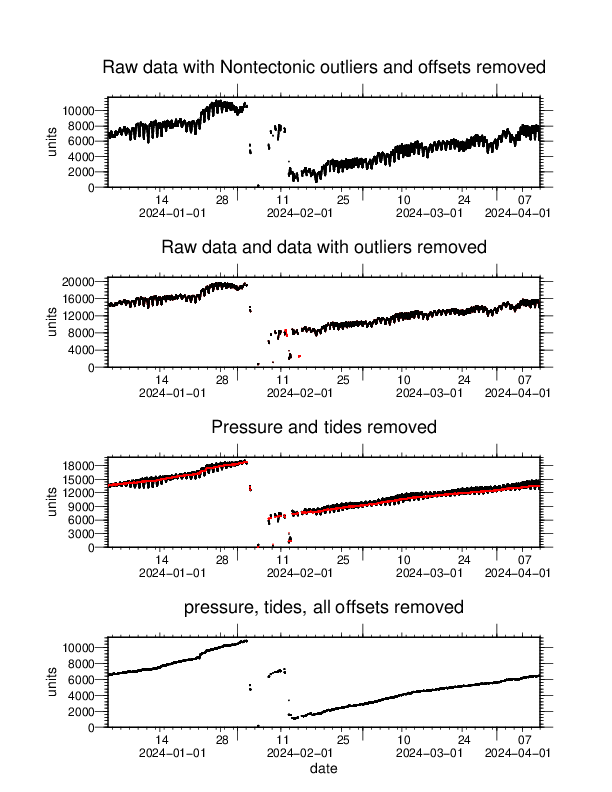
The next set of plots shows the steps in reducing the raw data to the residual strain changes. In each of the three plots of the data, there are four traces. The gray trace represents the raw data. The blue trace represents those data adjusted for changes in atmospheric pressure. The green trace is the atmospheric pressure data, but, it has been multiplied by the coefficient that is sensitivity of the strain data to the pressure. The heavy purple trace represents the data with the earth tide and pressure removed and all transients (whether instrumental, tectonic, or unknown). The red trace represents the data with the earth tide, pressure and known intrumental problems removed (ie, plot includes strain changes from tectonic or other non-instrumental causes). (Often the red and purple traces will be the same). And the dashed, black line is the fit of the linear trend and a rate change to the adjusted for changes in pressure and the earth-tide. The red, vertical dashed line represents the time where the time-series is split; prior data is represented as a rate and data after the vertical line is represented by the rate plus a rate change. The value of the rate change and its standard error is shown just above the vertical line. The green, vertical dashed line represents the time of any known, instrumental offset (a valve opening) in the data; once an offset has been identified, the size is estimated and removed from the data. For the Dilatometer data, they have been calibrated against the earth tide so the changes plotted are in NanoStrain. For the three component instruments, they have not calibrated the strainmeters against the predicted earth tide. Instead, the data are plotted as dimensionless units.
The plot in the top panel is the absolute value of the strain rate normalized to the standard error in strain rate. This i s a good method for detecting small outliers in the strain data. For instance, teleseismic arrivals, which are aliased by the 10 minute sampling can be easily detected by this simple algorithm.
| Station | PLOTS |
|---|---|
| Garin ga | rate change |
| Mill Creek mc | rate change |
| Russel Ranch rr | rate change |
| Sunol su | rate change |
| Coyote cy | rate change |
| Brisbane Sensor 1 bb01 | rate change |
| Brisbane Sensor 2 bb02 | rate change |
| Brisbane Sensor 3 bb03 | rate change |
| Brisbane tilt N-S bb00 | rate change |
| Brisbane tilt E-W bb90 | rate change |
| Marin Headlands Sensor 1 mh01 | rate change |
| Marin Headlands Sensor 2 mh02 | rate change |
| Marin Headlands Sensor 3 mh03 | rate change |
| Ox Mtn. Sensor 1 ox01 | rate change |
| Ox Mtn. Sensor 2 ox02 | rate change |
| Ox Mtn. Sensor 3 ox03 | rate change |
| Saint Vincents Sensor 1 sv01 | rate change |
| Saint Vincents Sensor 2 sv02 | rate change |
| Saint Vincents Sensor 3 sv03 | rate change | Ohlone Sensor 1 oh01 | rate change |
| Ohlone Sensor 2 oh02 | rate change |
| Ohlone Sensor 3 oh03 | rate change |
| Donna Lee (Parkfield) dl | rate change |
| Frohlich (Parkfield) fr | rate change |
| Vineyard Canyon (Parkfield) vc | rate change |
| Red Hills (Parkfield) rh | rate change |
| Jack Canyon (Parkfield) jc | rate change |
| Big Dalton (Southern Calif) bd | rate change |
| Chantry Flat (Southern Calif) cn | rate change |
| Postpile (Long Valley) po | rate change |
| Moto Cross (Long Valley) mx | rate change |
| Big Springs (Long Valley) bg | rate change |
| Long Baseline tilt, E-W (Long Valley) lbew | rate change |
| Long Baseline tilt, N-S (Long Valley) lbns | rate change |
| Big Springs, N-S (Long Valley) bg00 | rate change |
| Big Springs, E-W (Long Valley) bg90 | rate change |
| MotoCross, N-S (Long Valley) mx00 | rate change |
| MotoCross, E-W (Long Valley) bg90 | rate change |
I
Locations of USGS strainmeters analyzed here.

Comparison of current and prior analysis of strain data
The following presents output of cleanstrain+ for the most recent 100 days and results from analysis of a previous 100-day chunk of strain data. For the comparison of pressure and tides, a pdf table is provided which lists all of the estimates for the pressure and 4 Tidal constituents. Please note that for many of the strainmeters, there will be an offset in the amplitudes of the tides because I switched the scale factor from instrument counts to a calibrated strain, NS.
| Region | Dilatometer Stack Plots: results from vthepub | ||
|---|---|---|---|
| last 100 days | last 30 days | last 10 days | |
| San Francisco Bay | 100 days | 30 days | 10 days |
| San Francisco Bay -- Tensor strainmeters | 100 days | 30 days | 10 days |
| Parkfield | 100 days | 30 days | 10 days |
| Long Valley Strain | 100 days | 30 days | 10 days |
| Long Valley Tilt | 100 days | 30 days | 10 days |
Web page updated, 31 August 2019