SF Bay Area crustal deformation monitoring
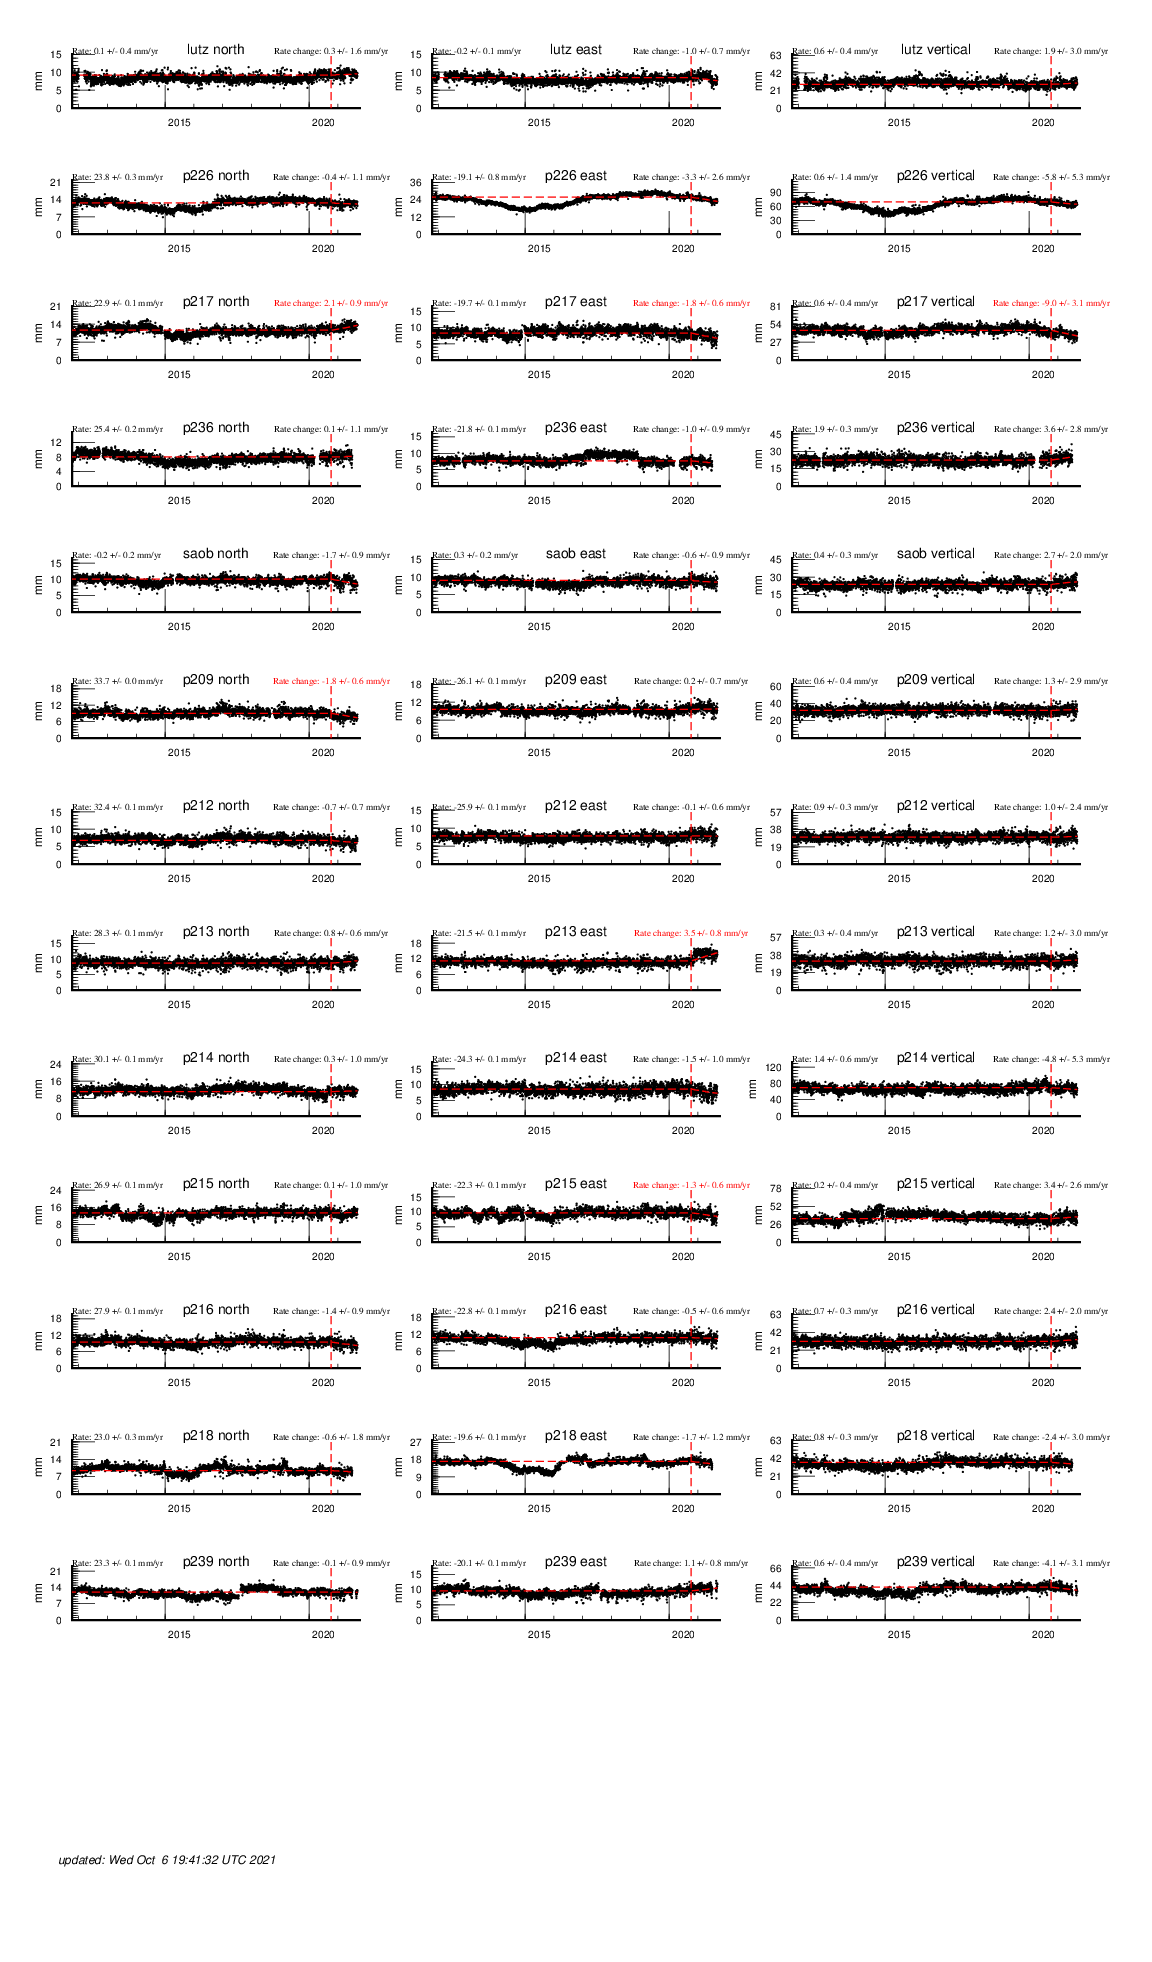
This page examines GPS along with creepmeter and strainmeter data that monitor deformation across the SF Bay region.
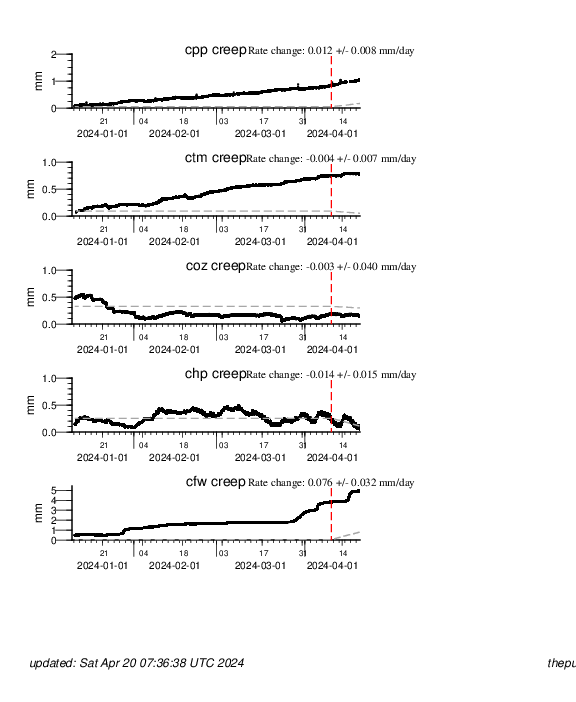
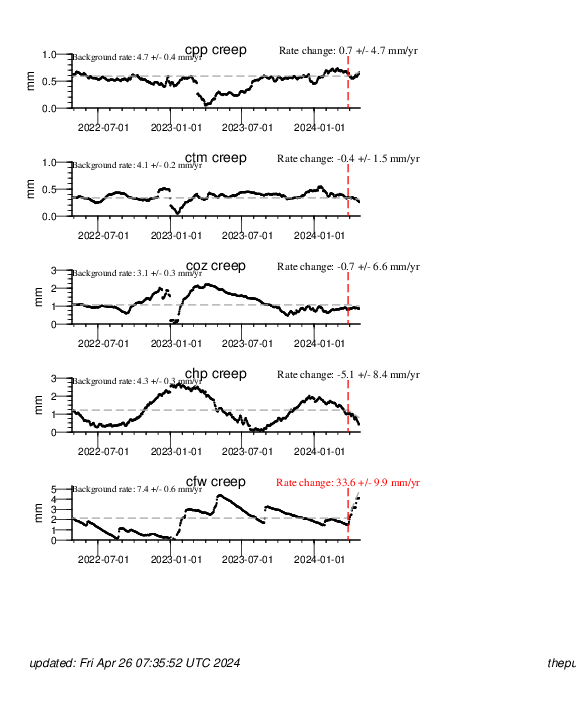
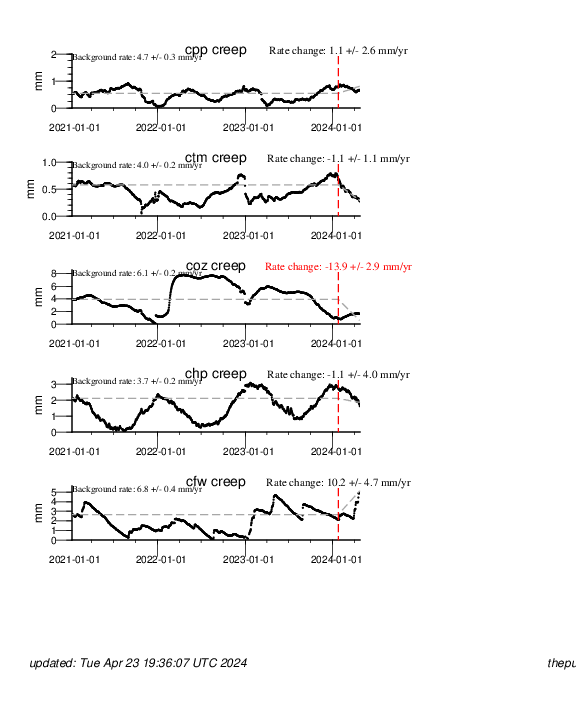
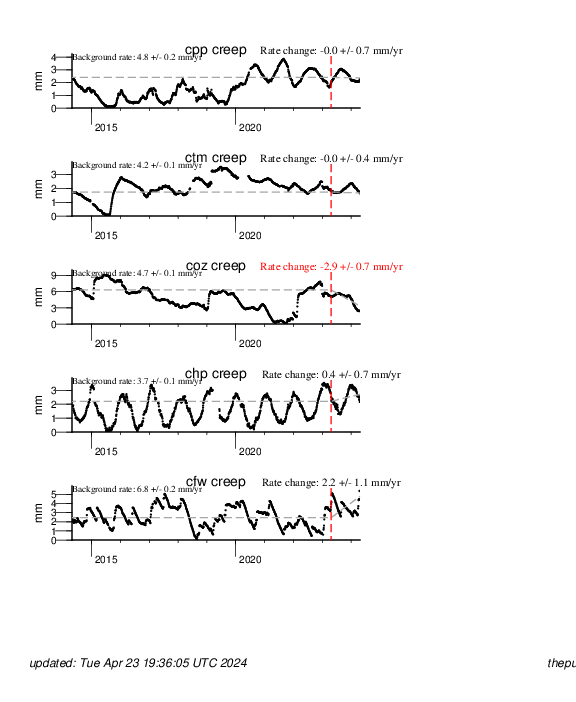
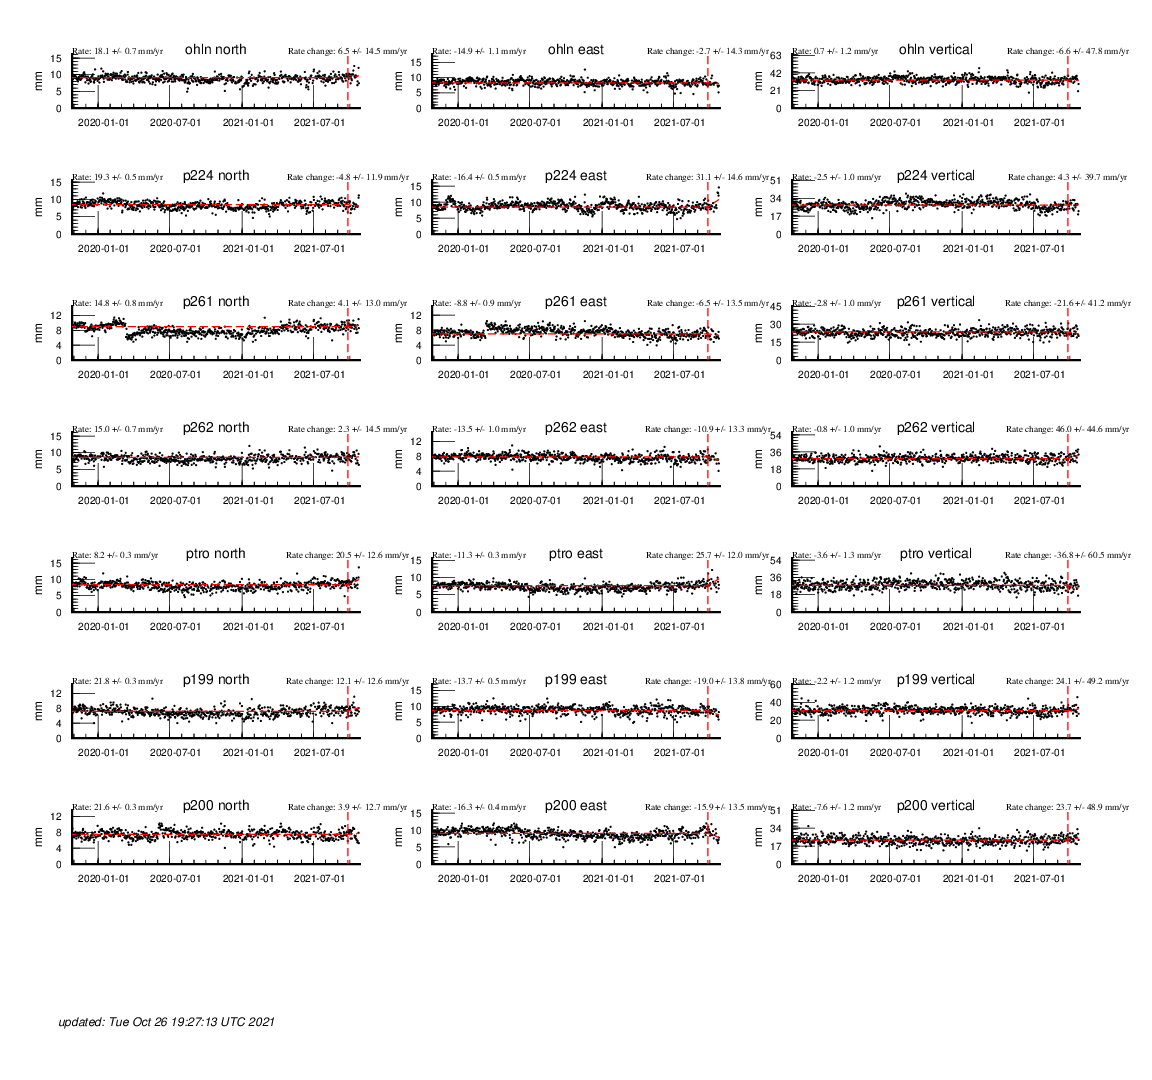
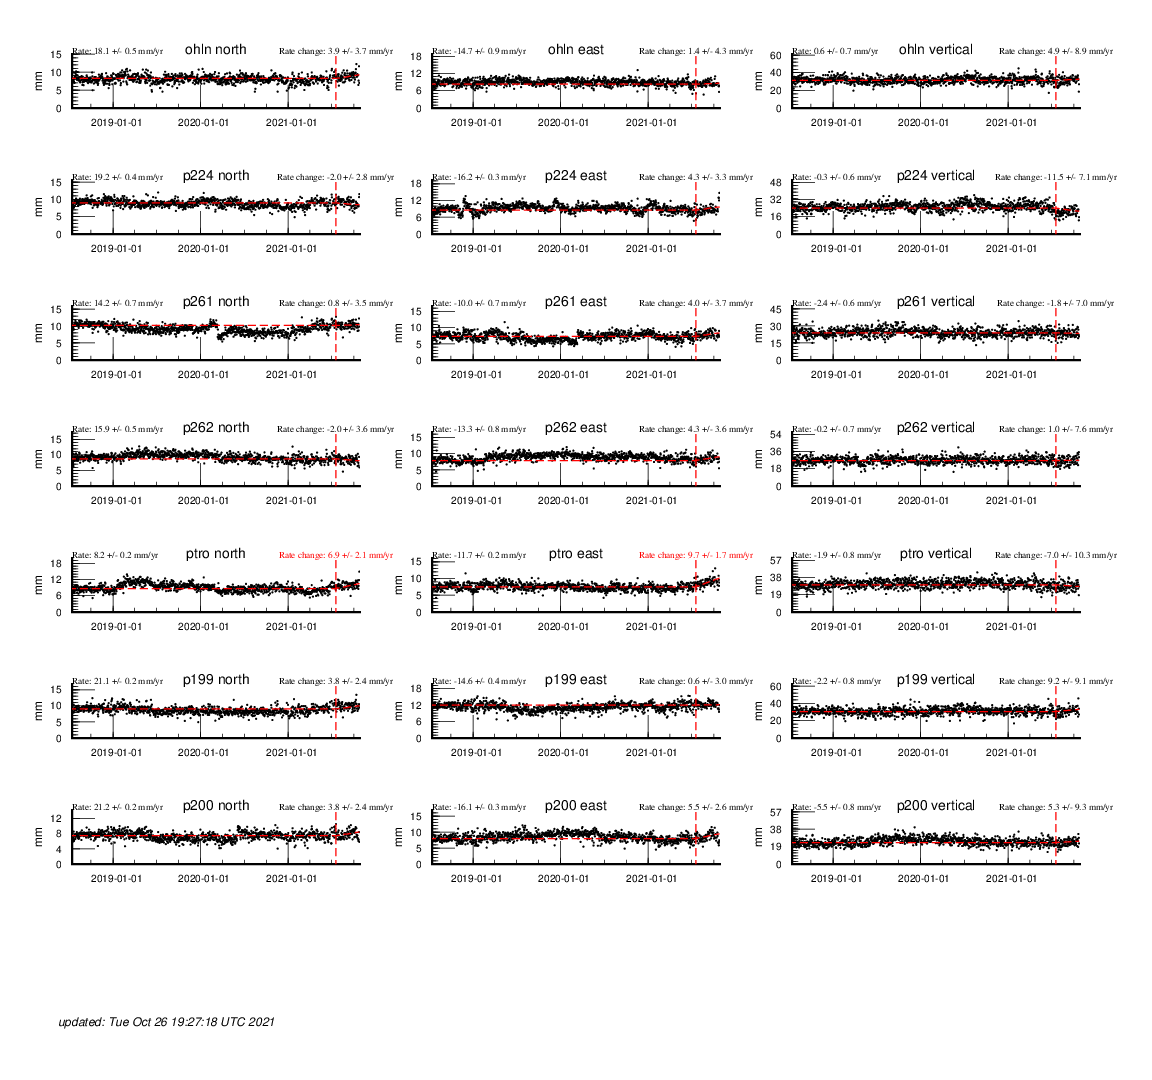
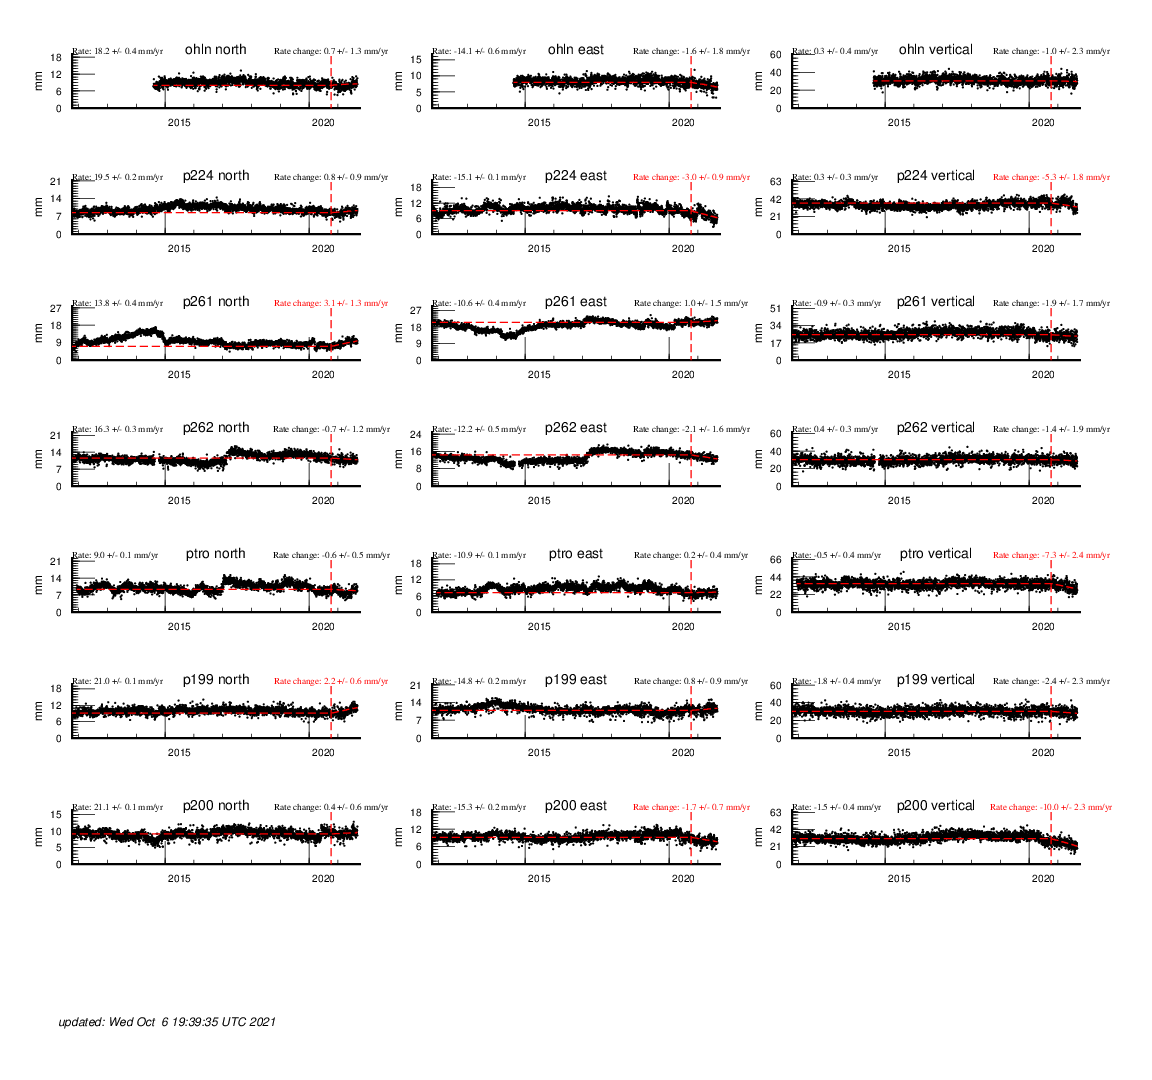
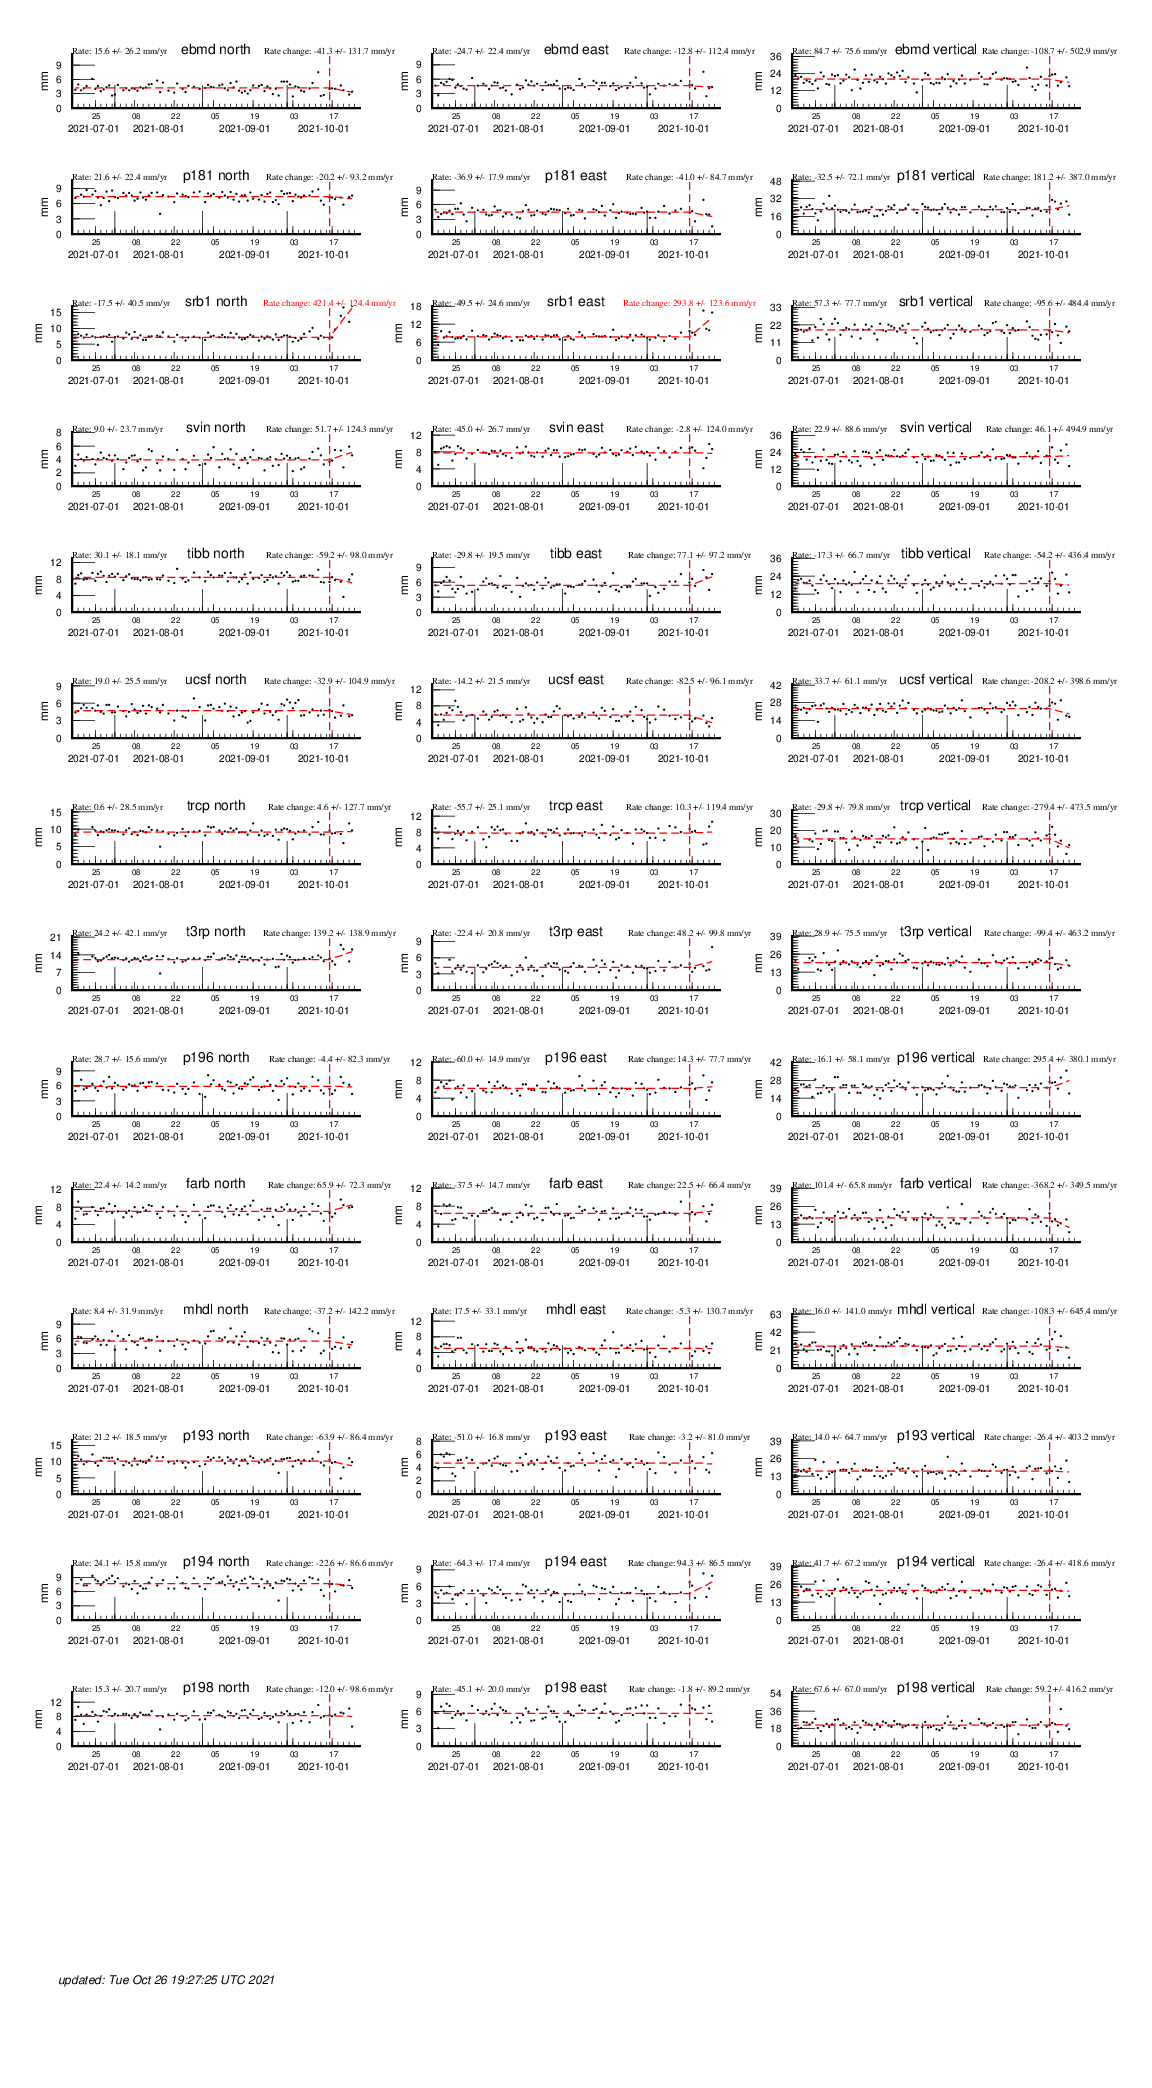
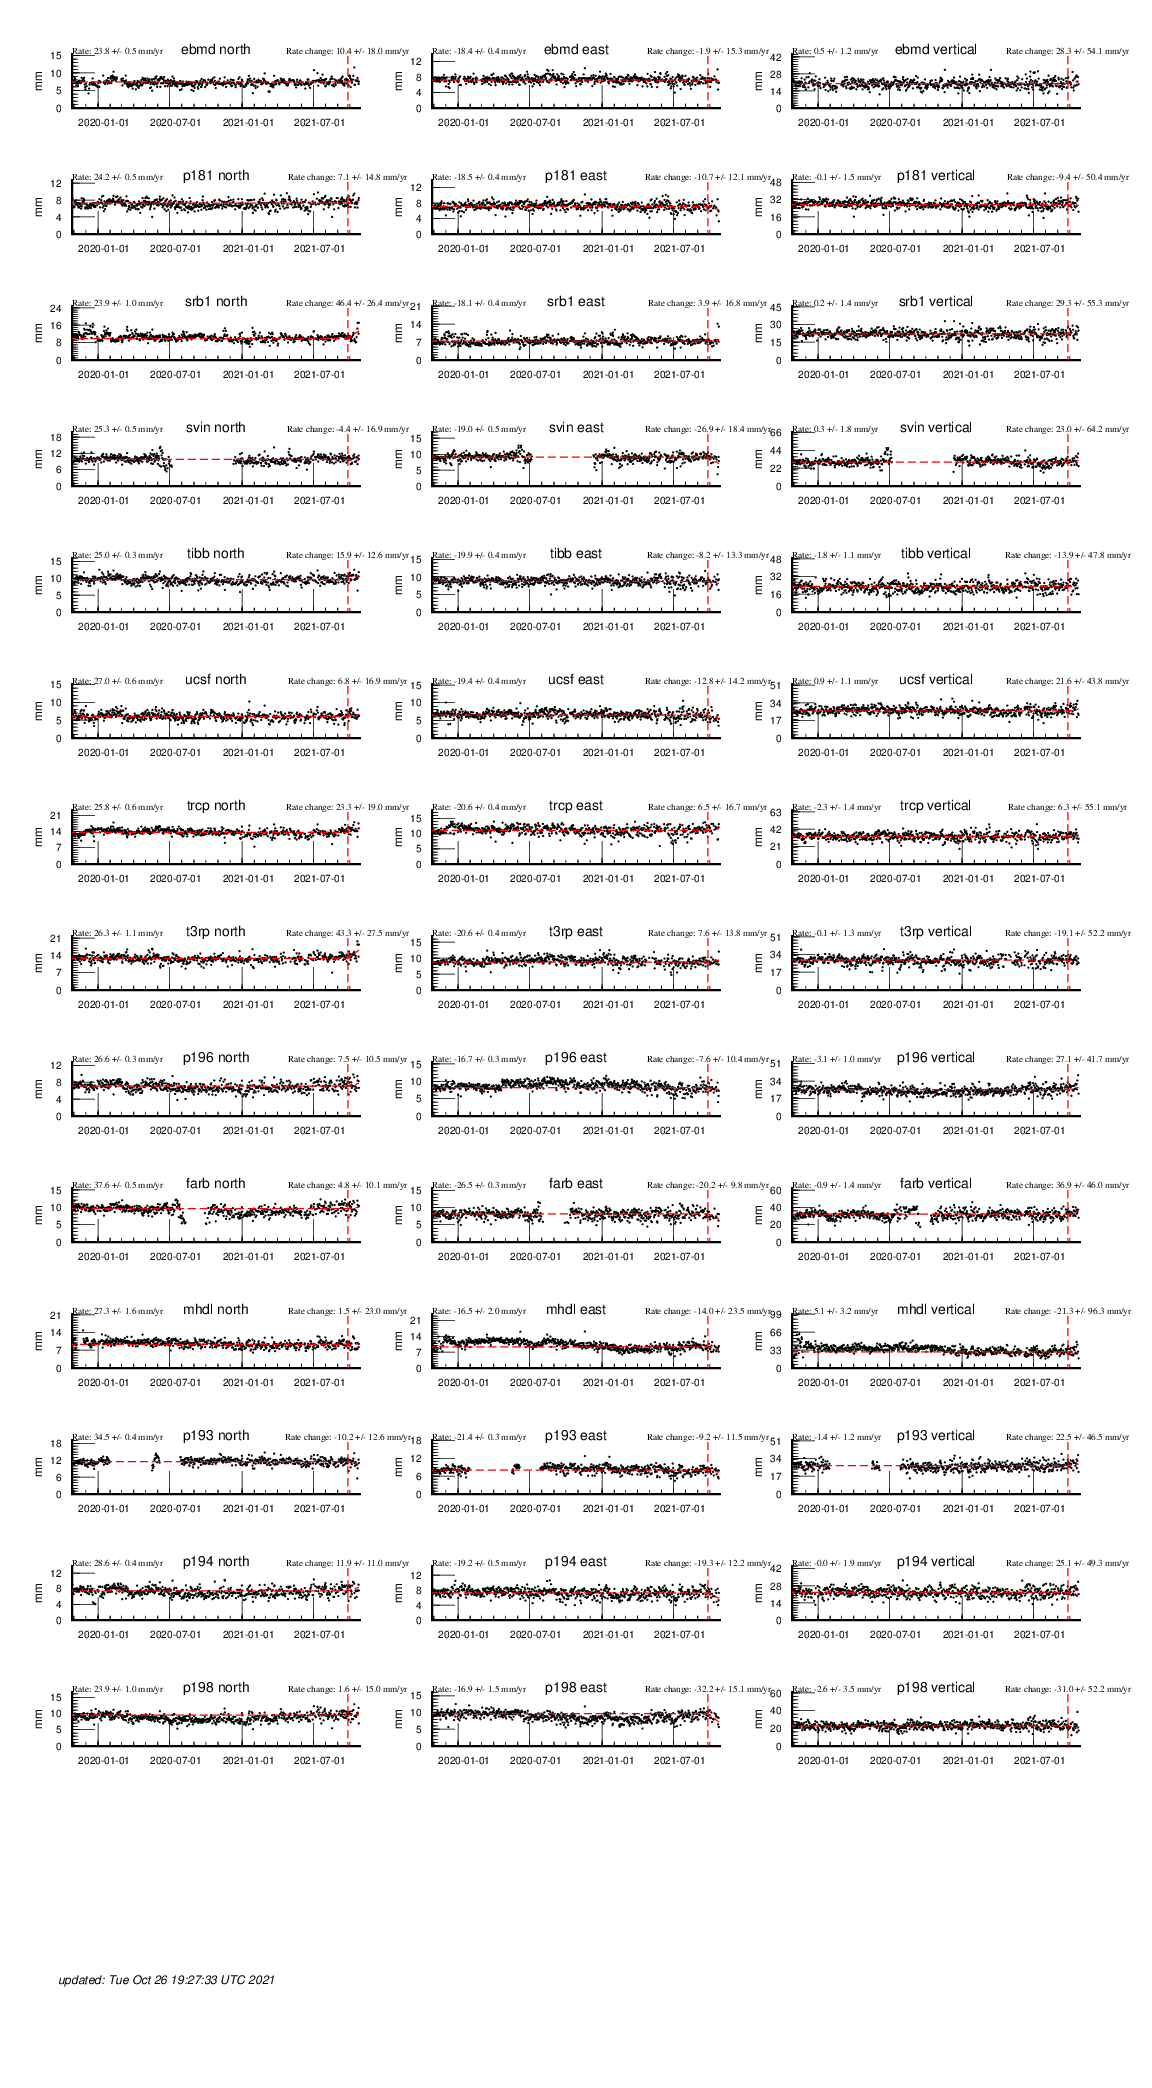
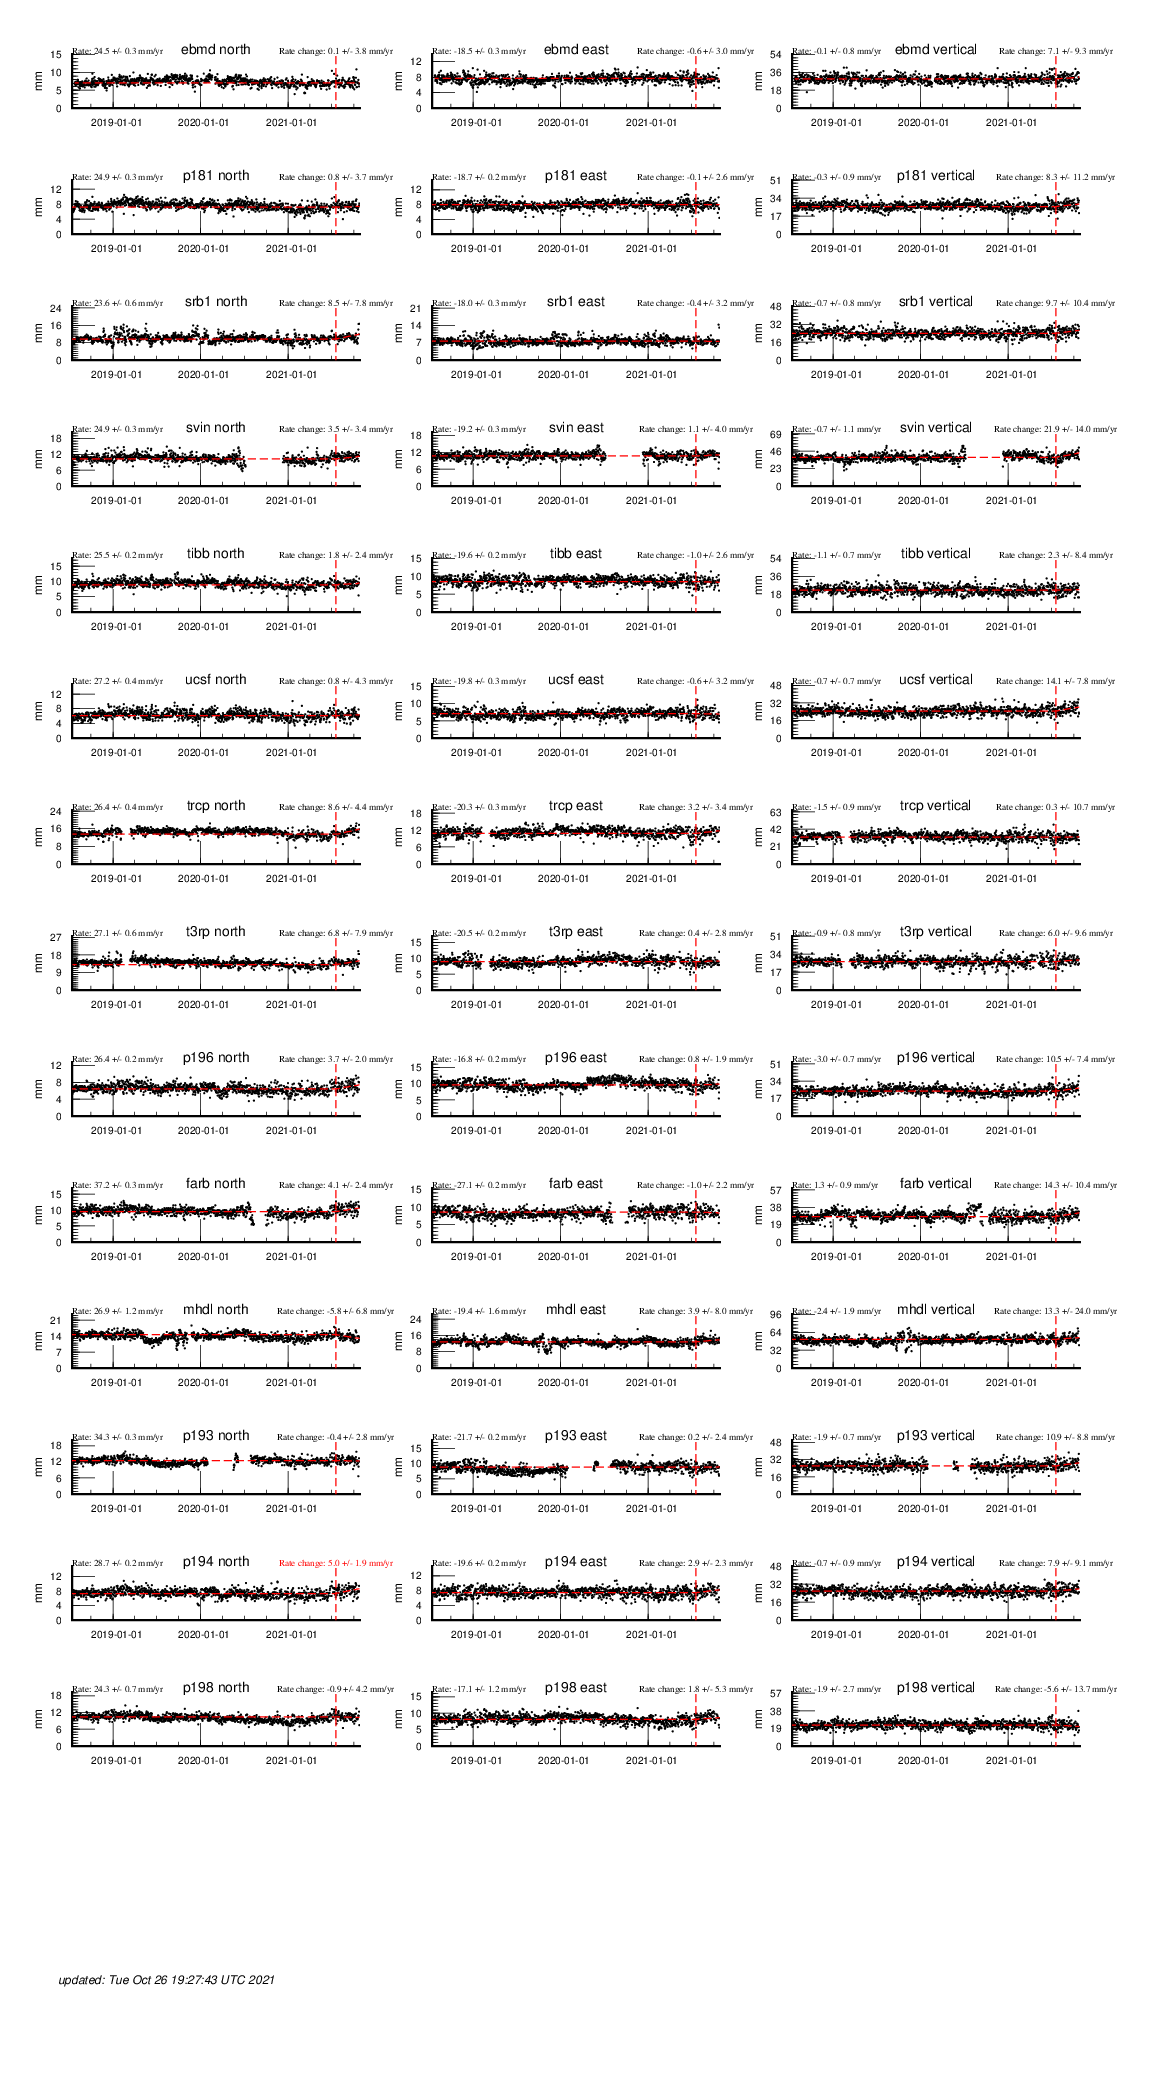
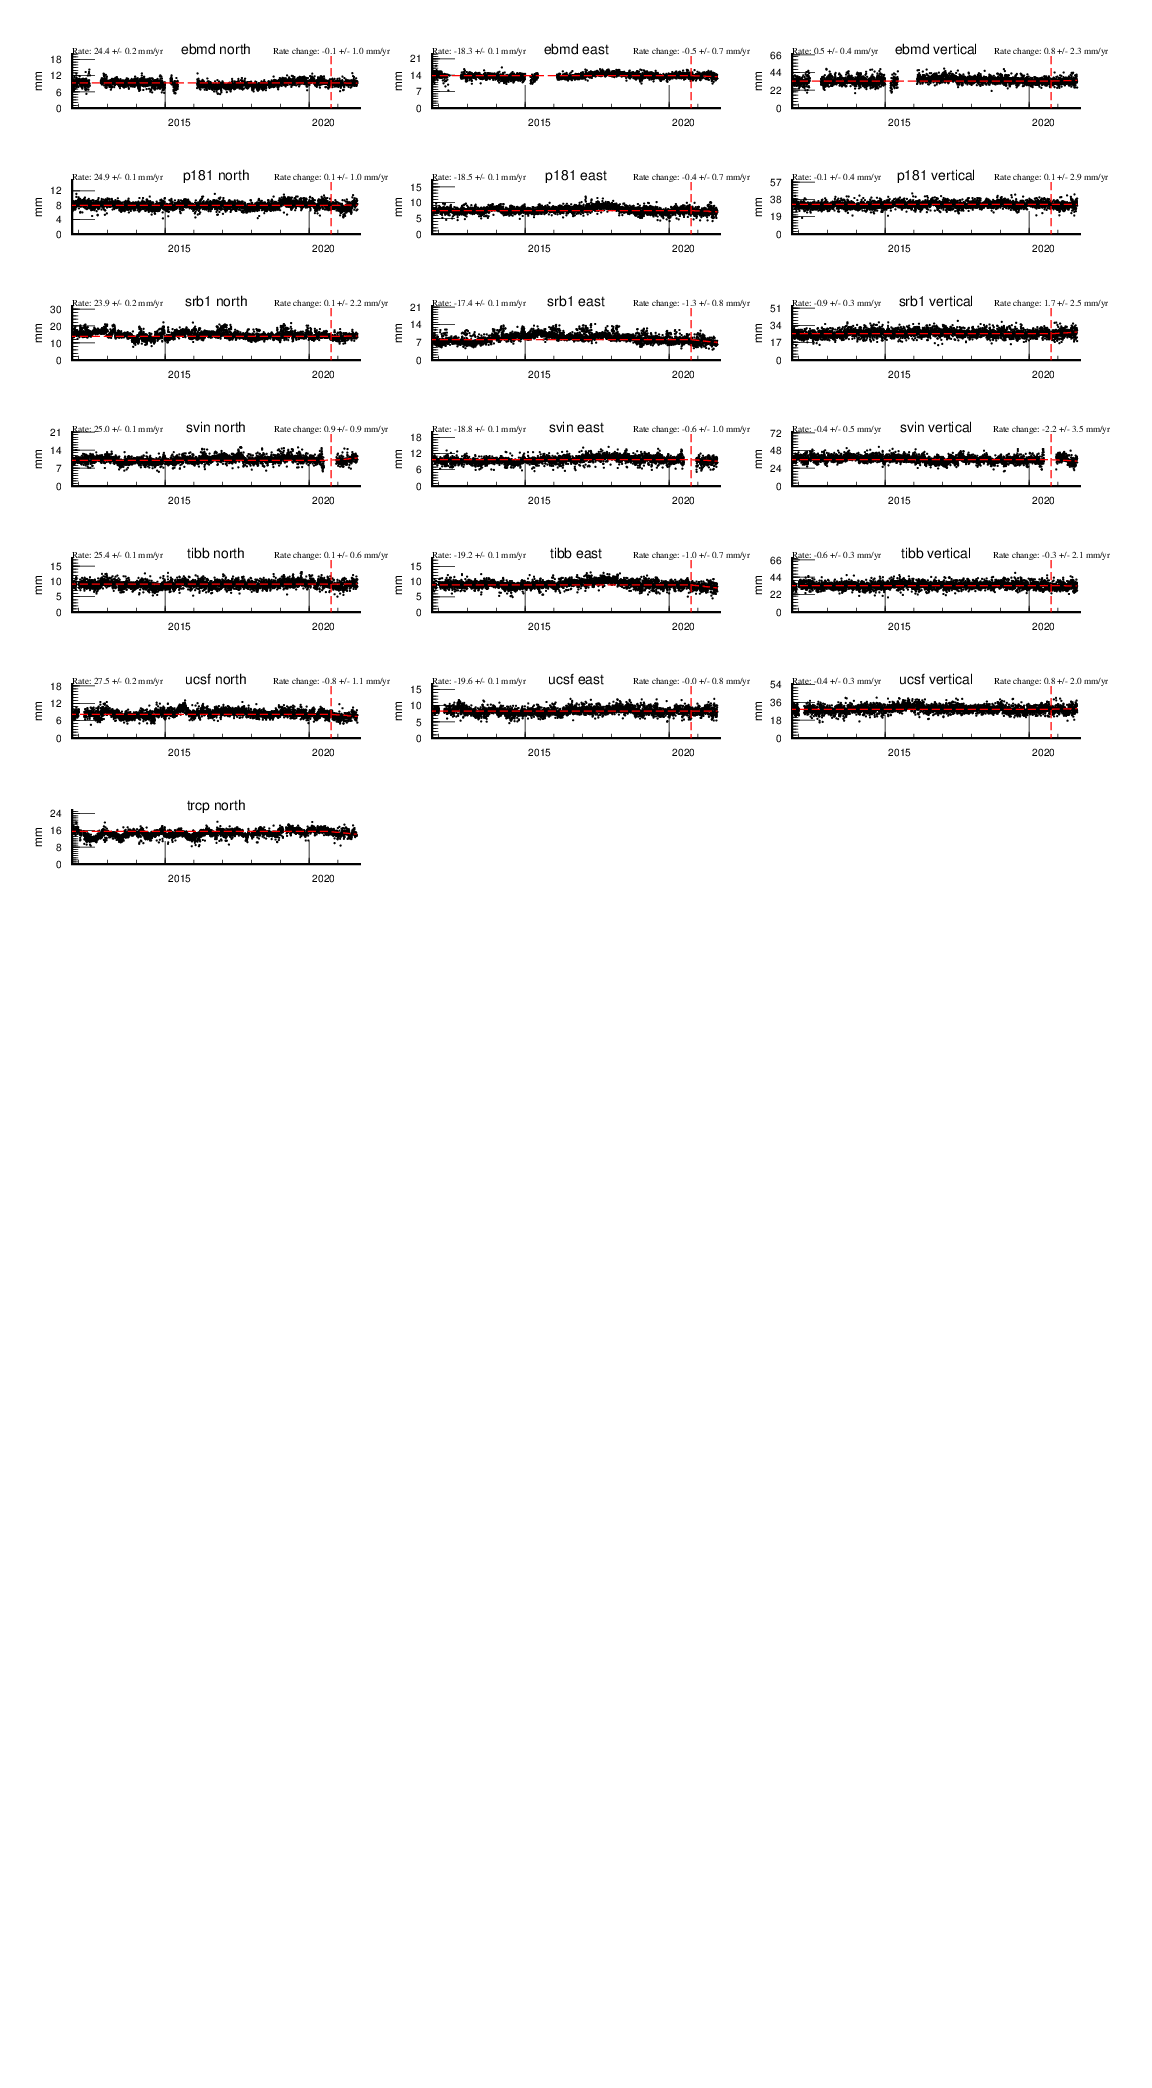
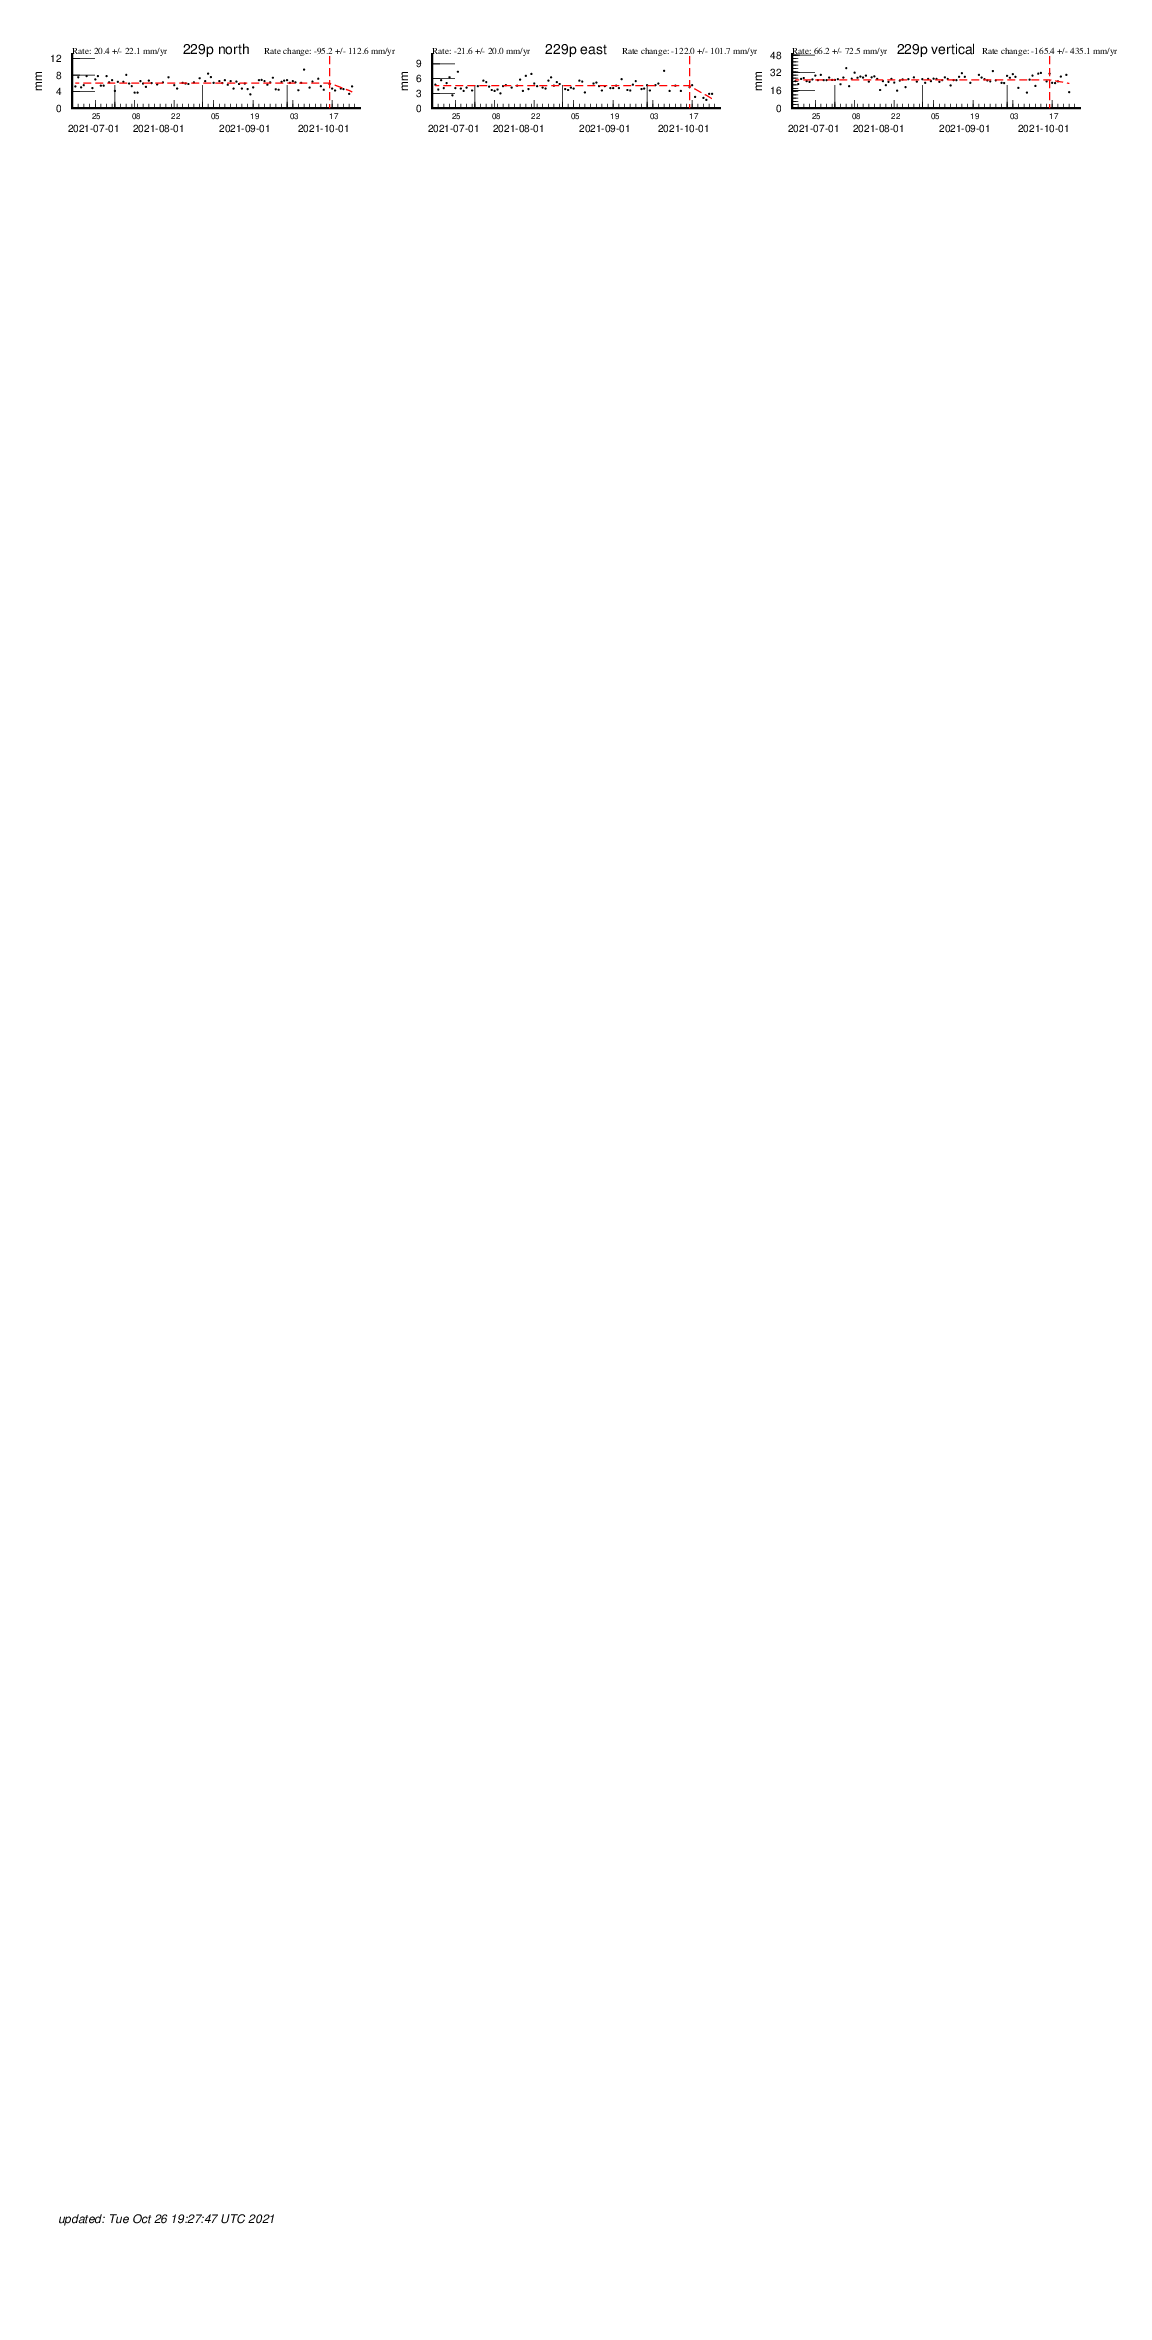
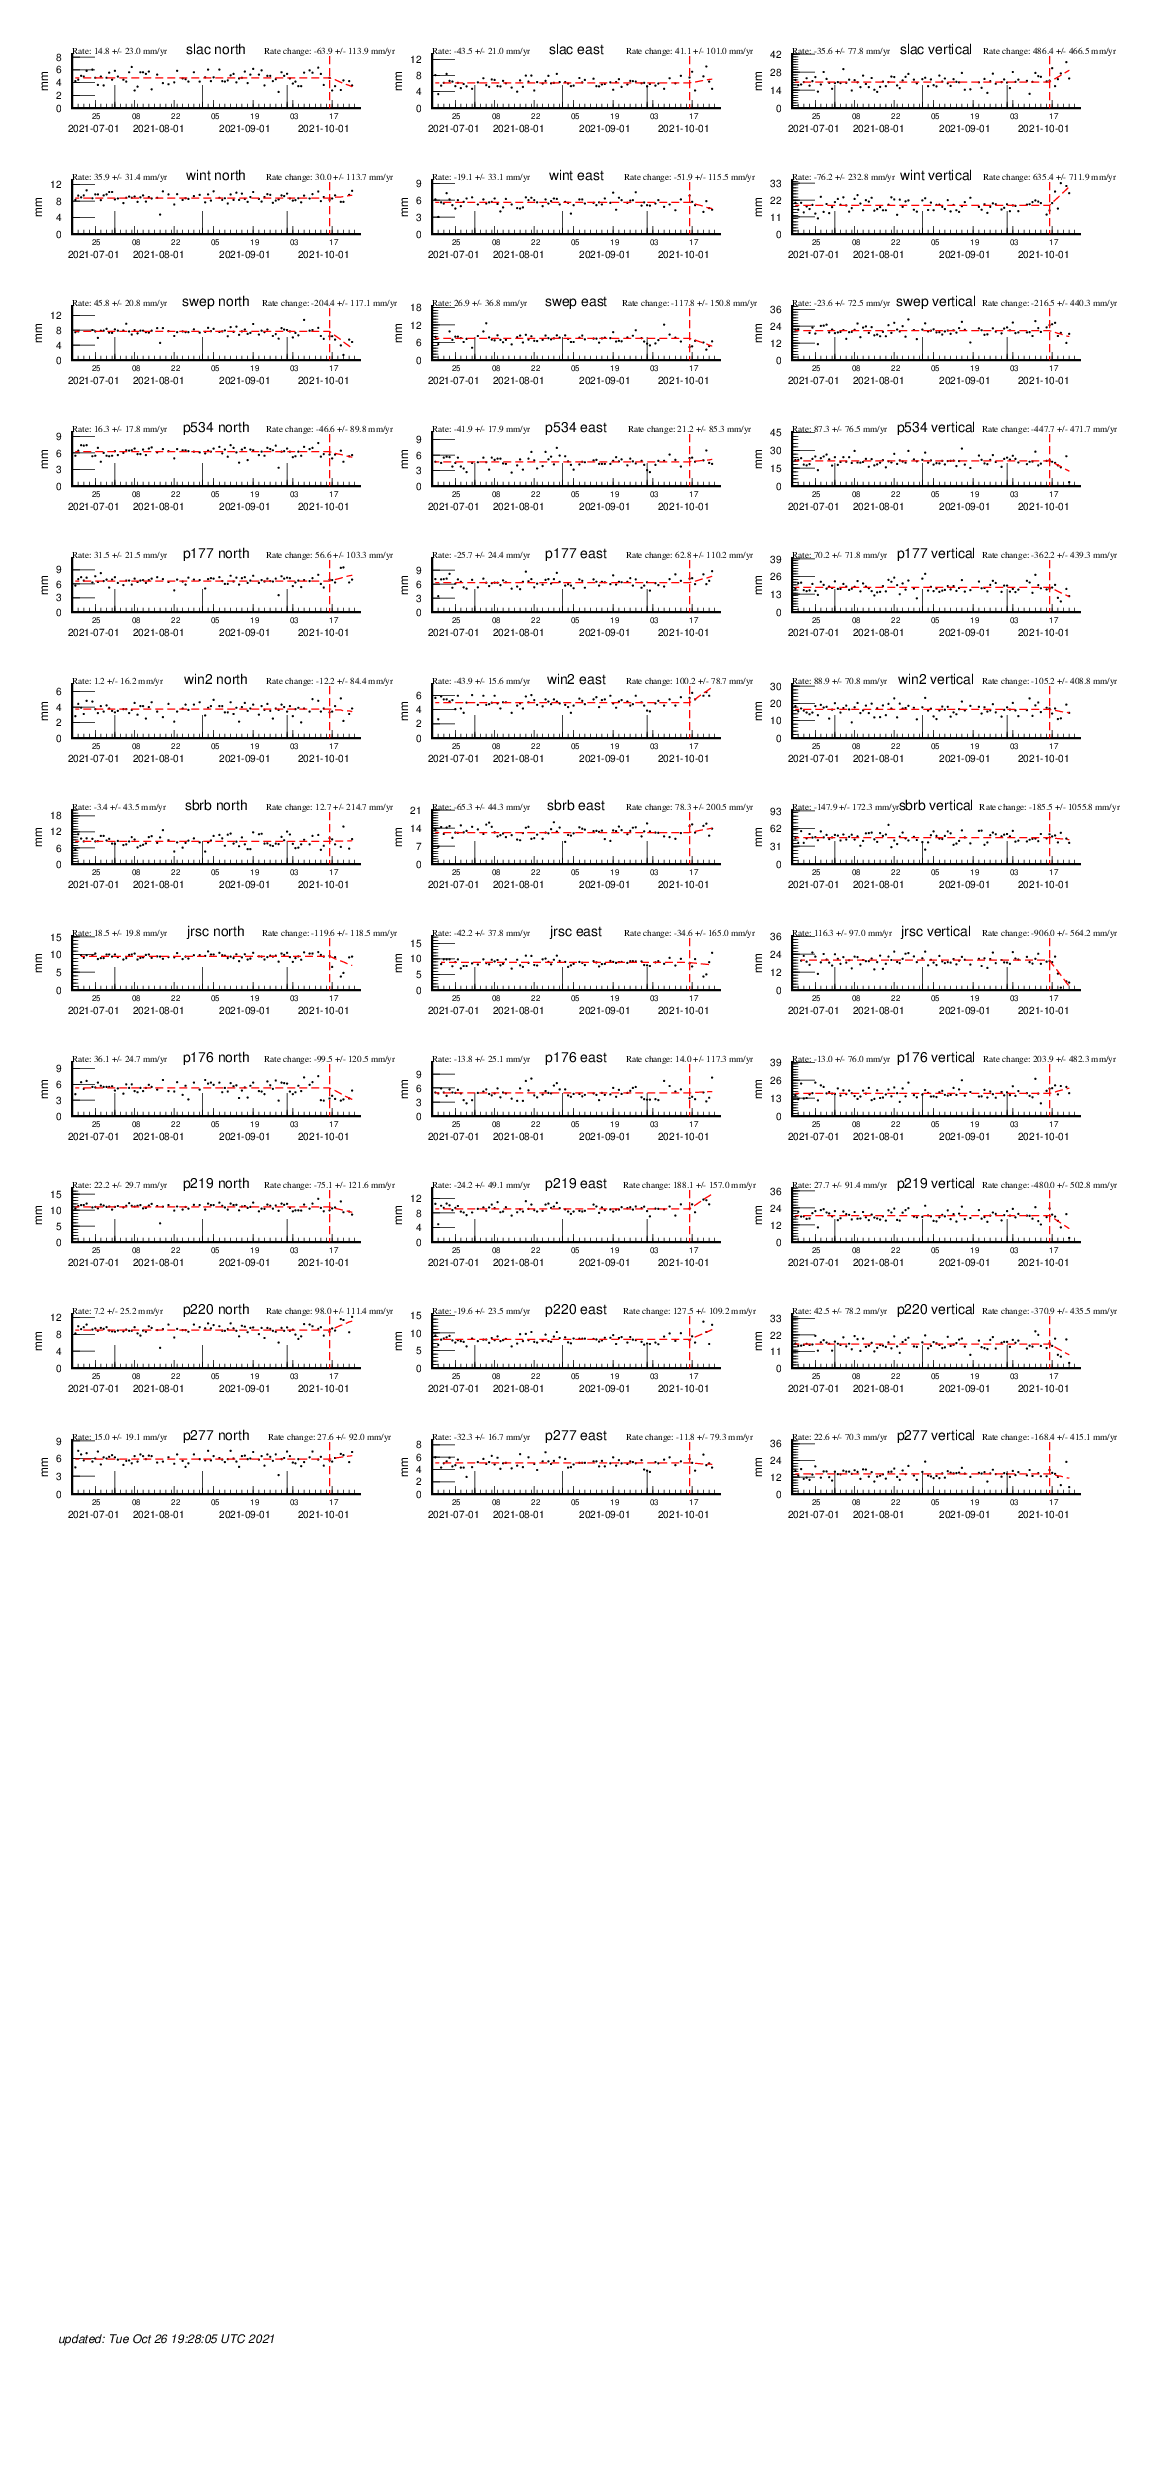
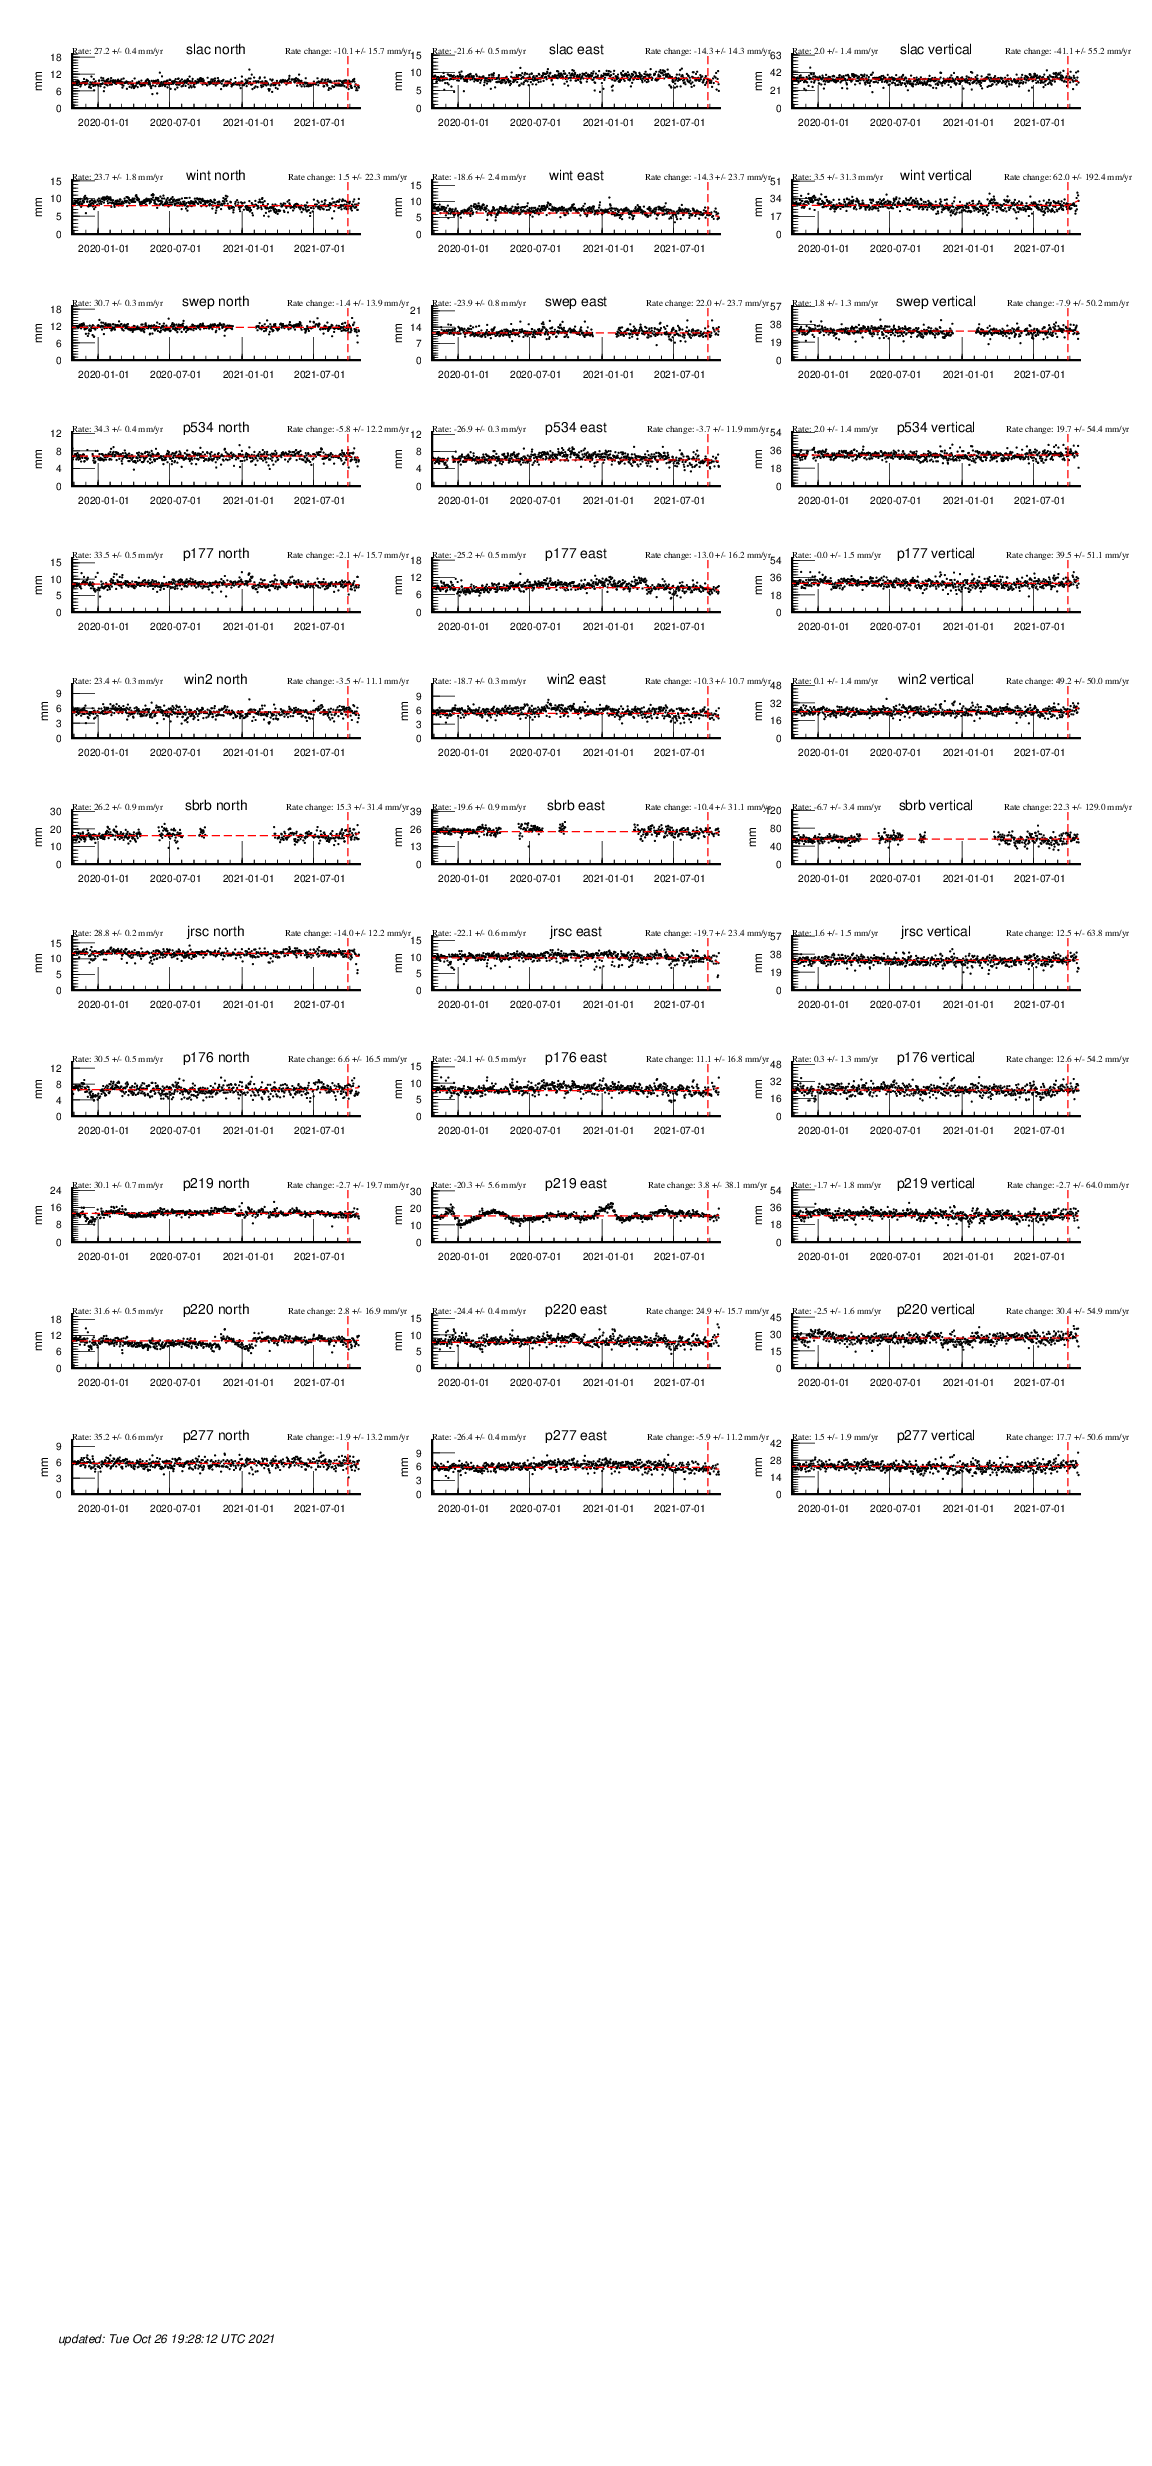
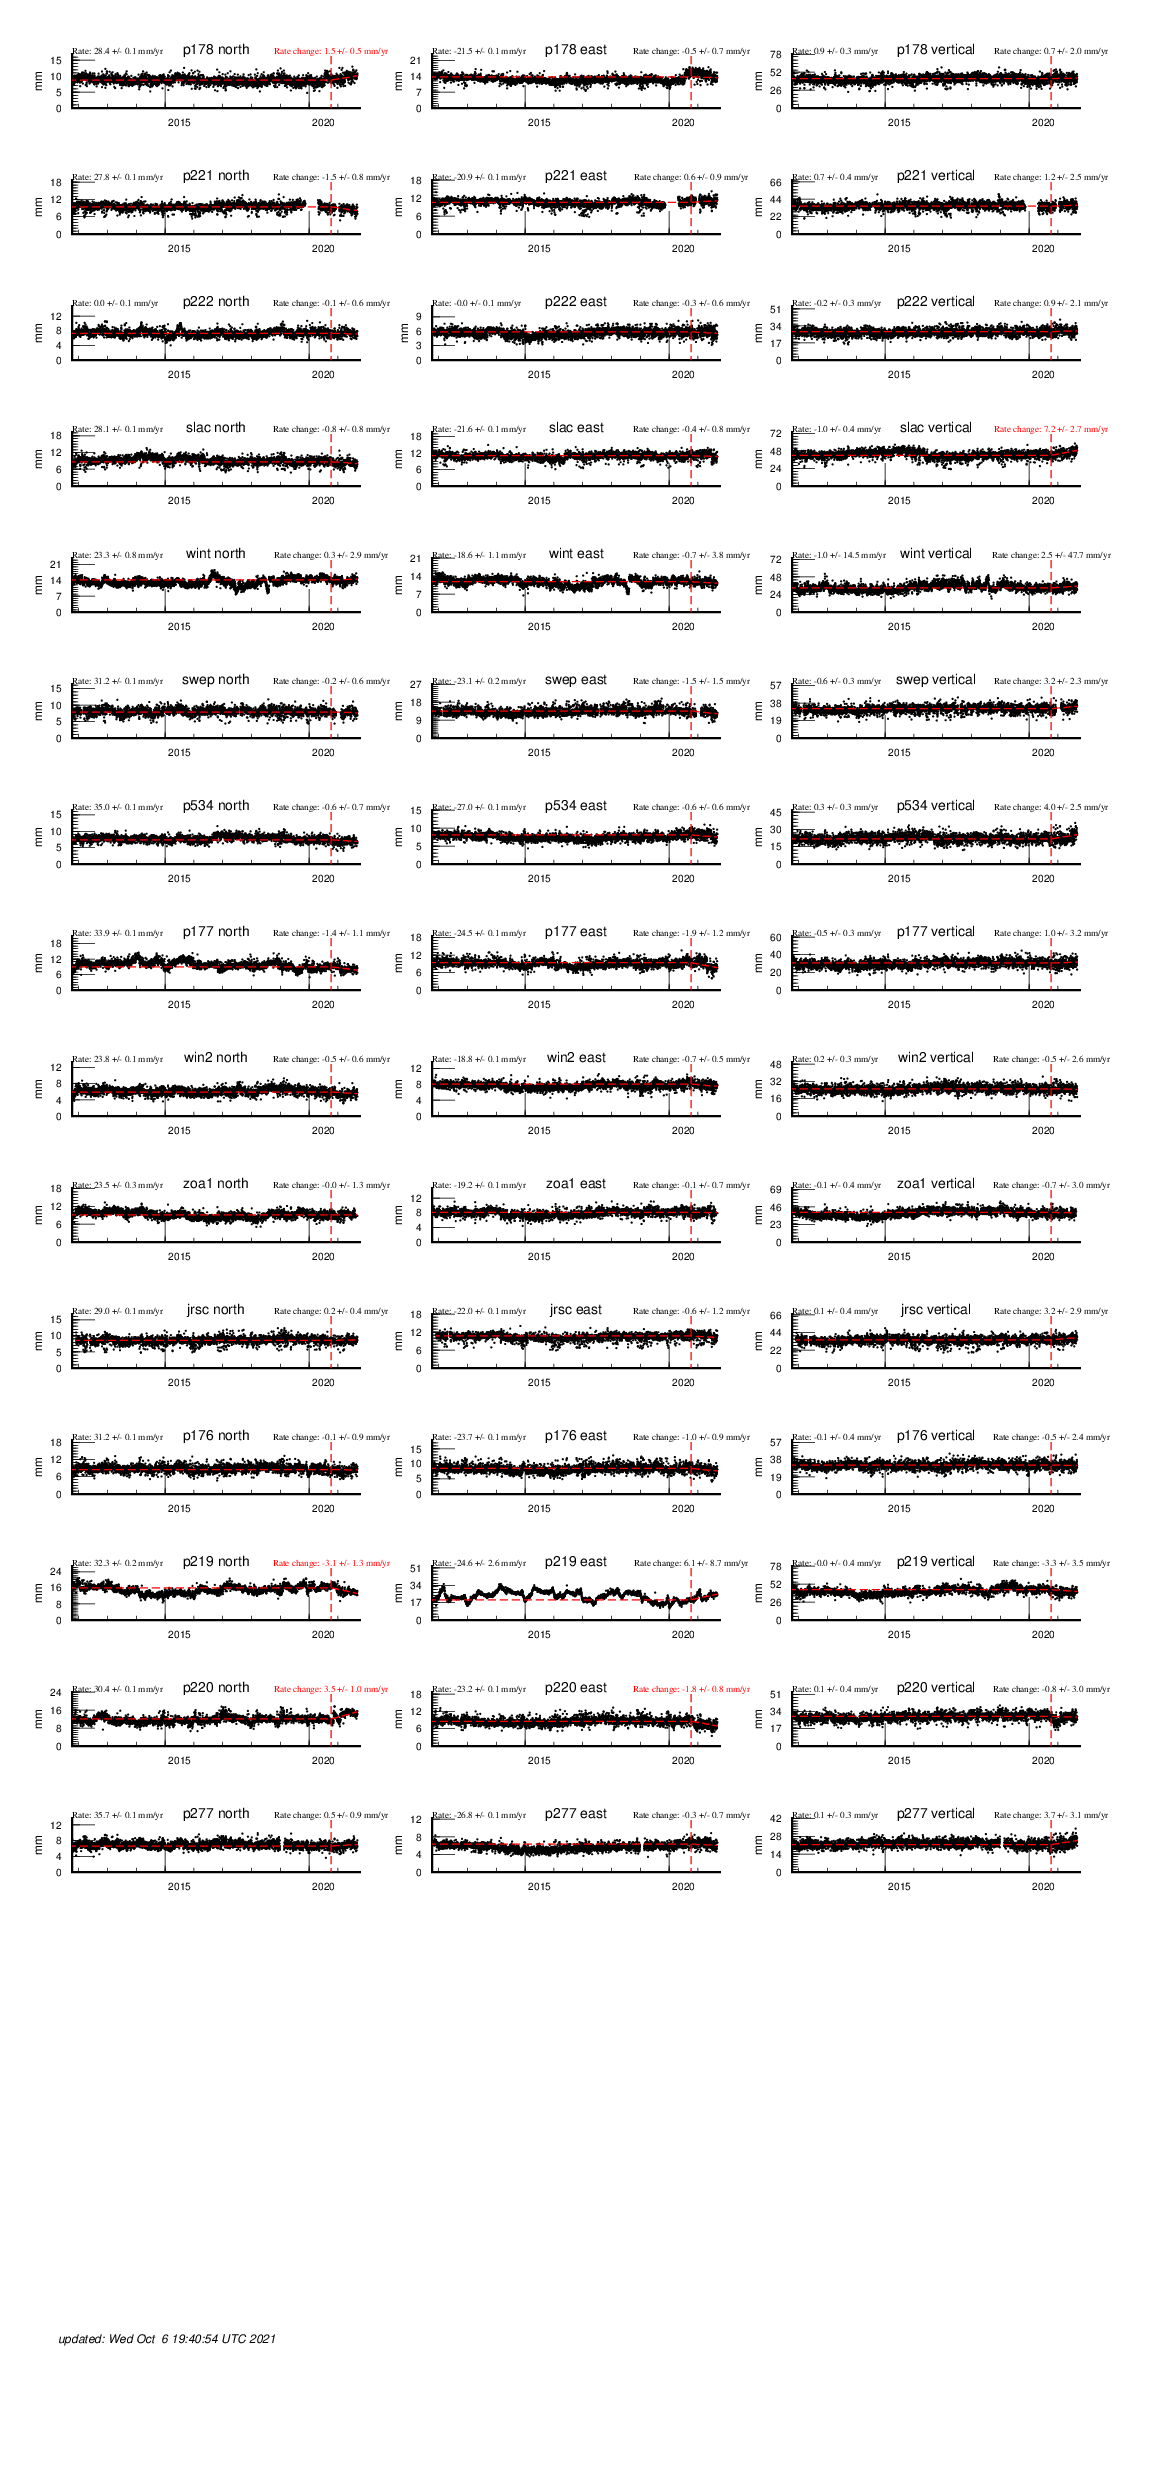
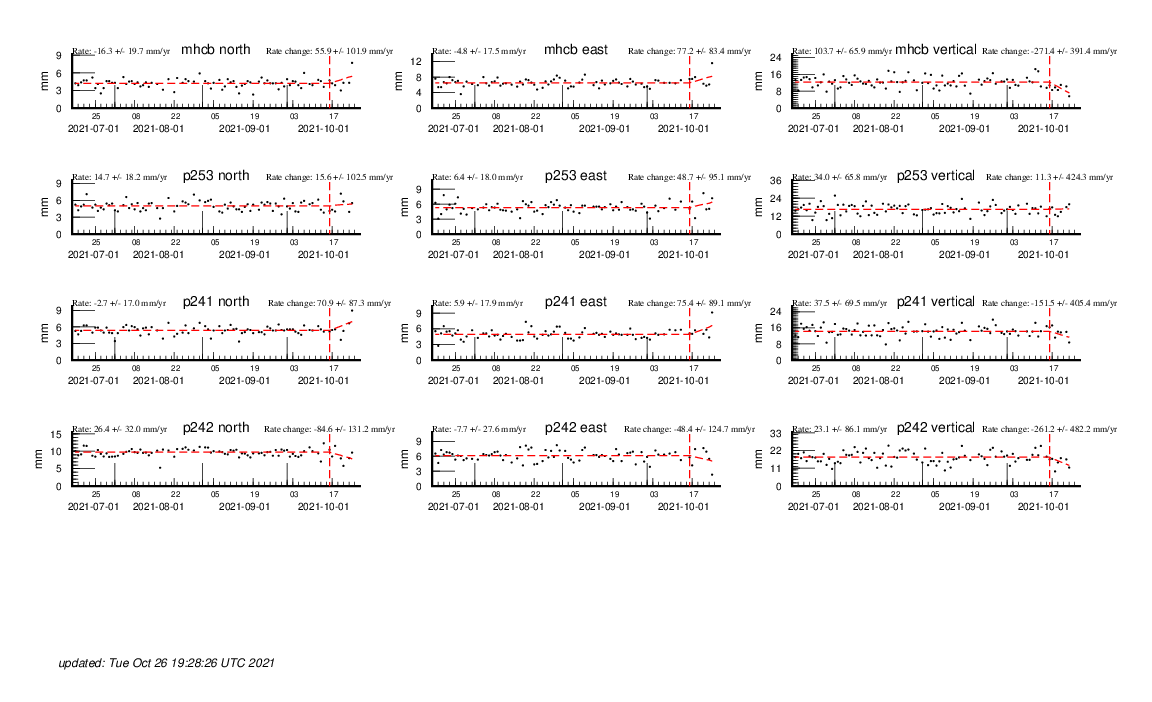
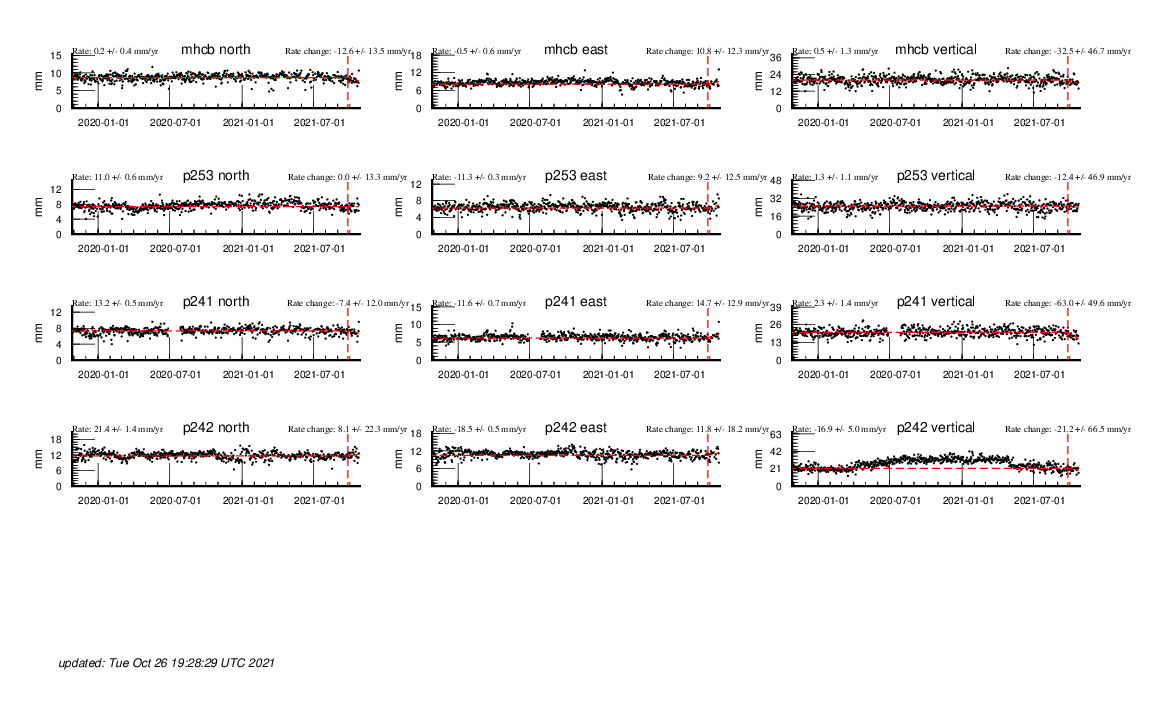
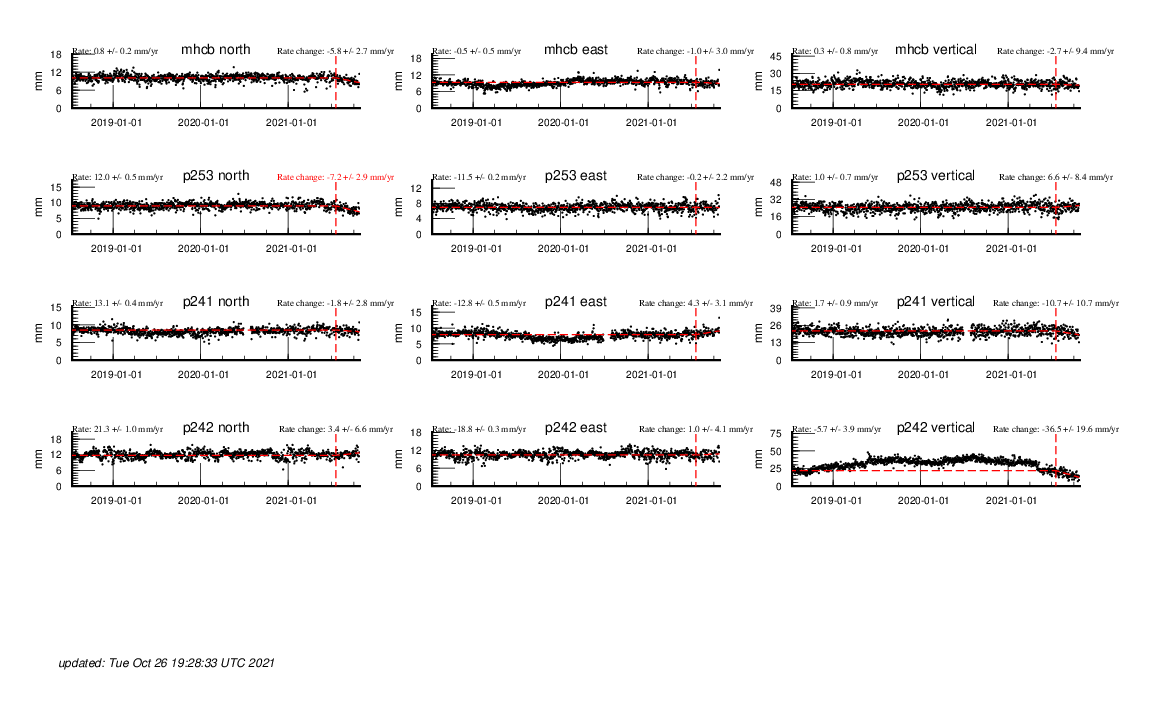
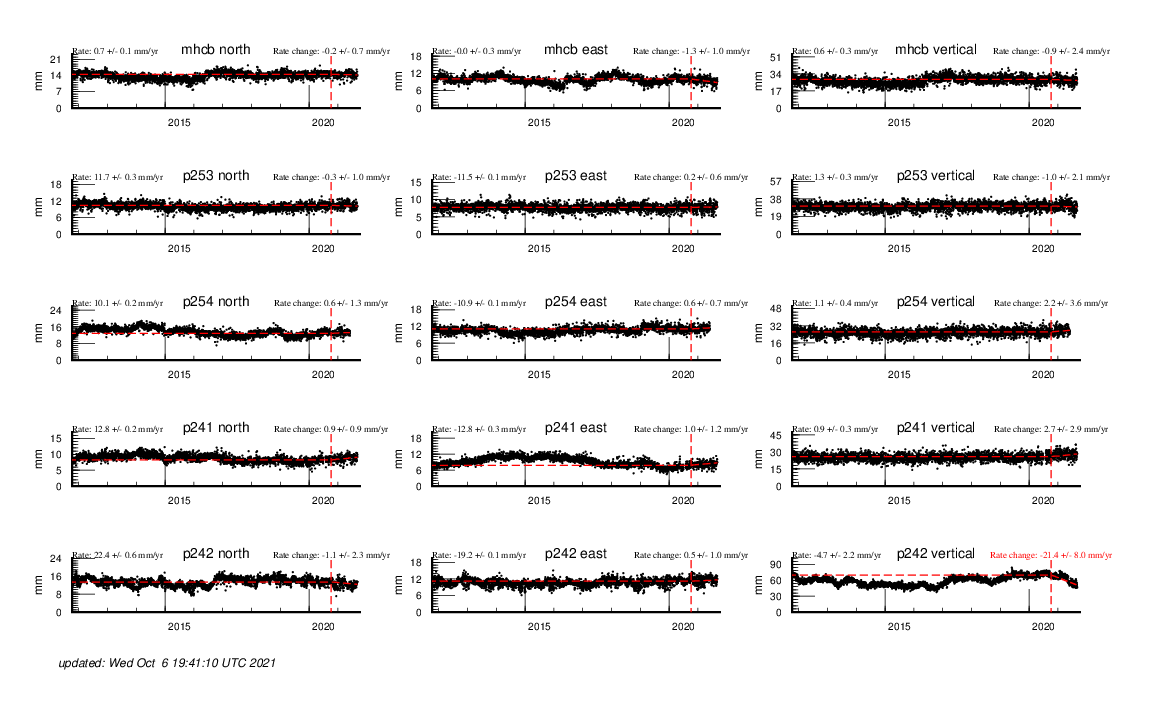
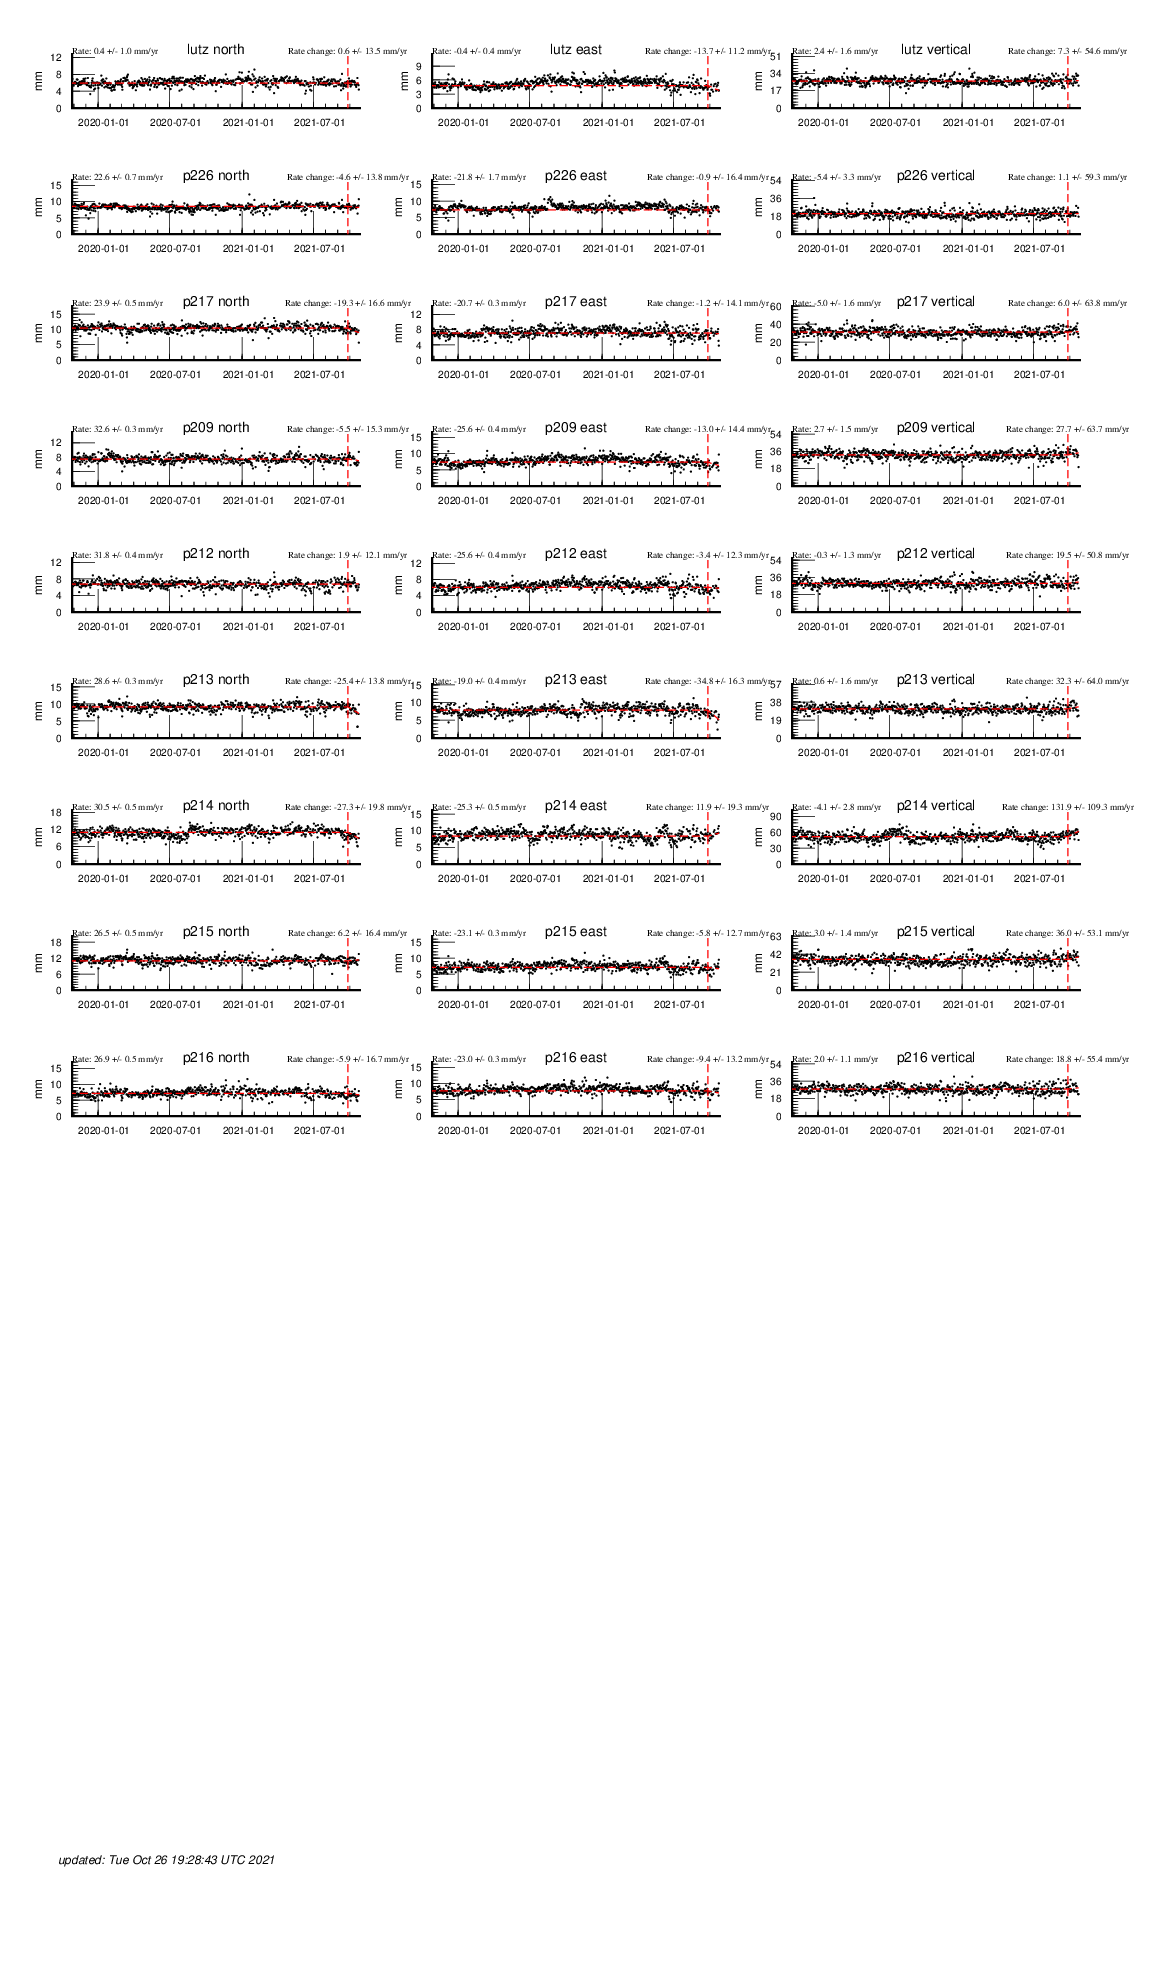
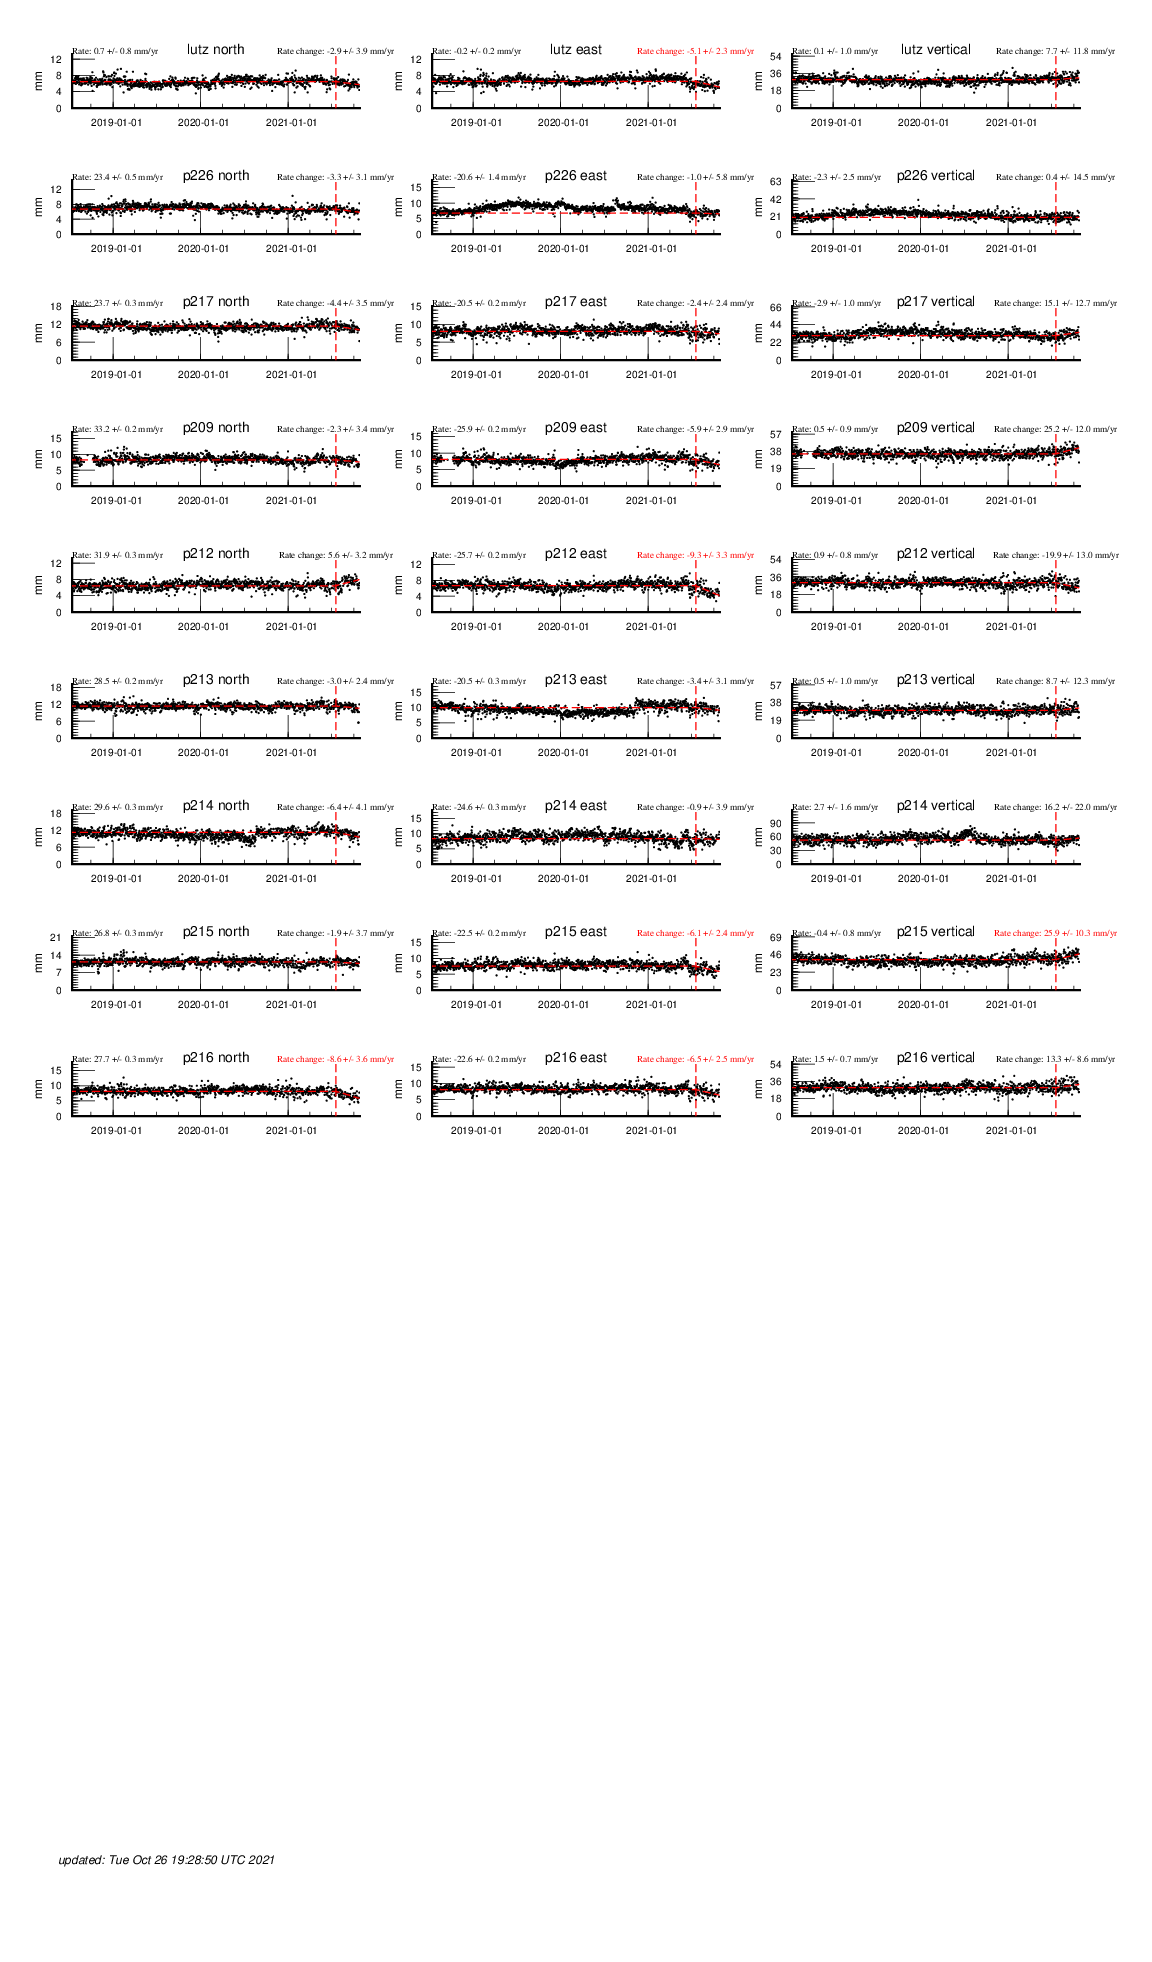
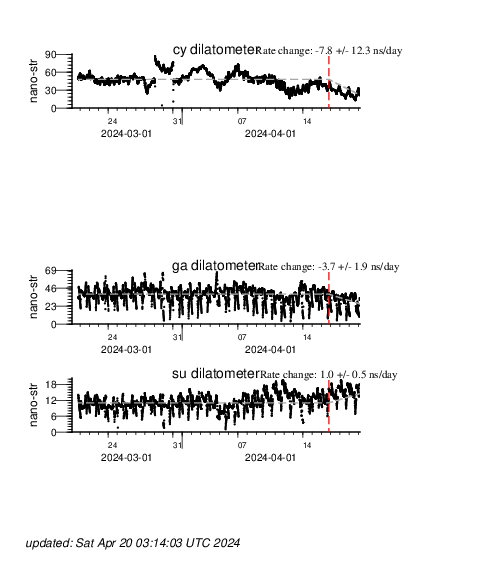
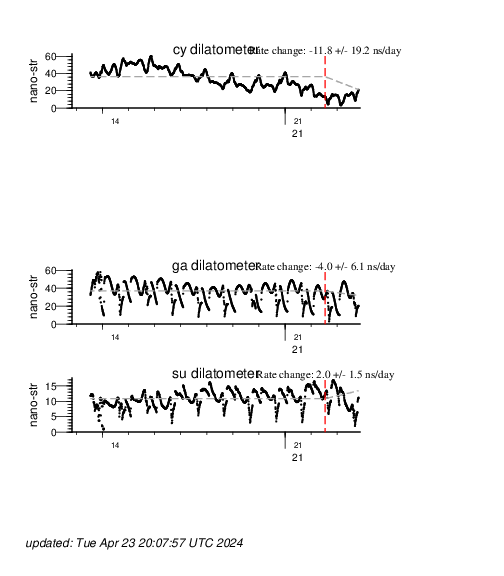
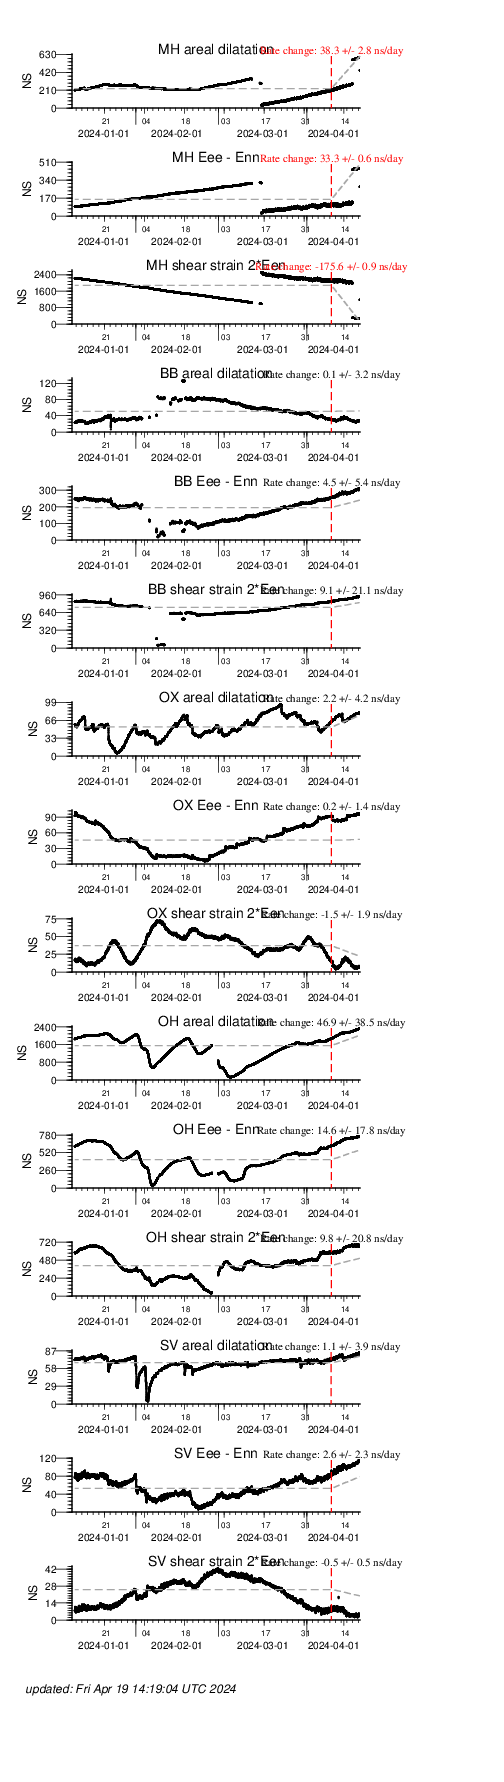
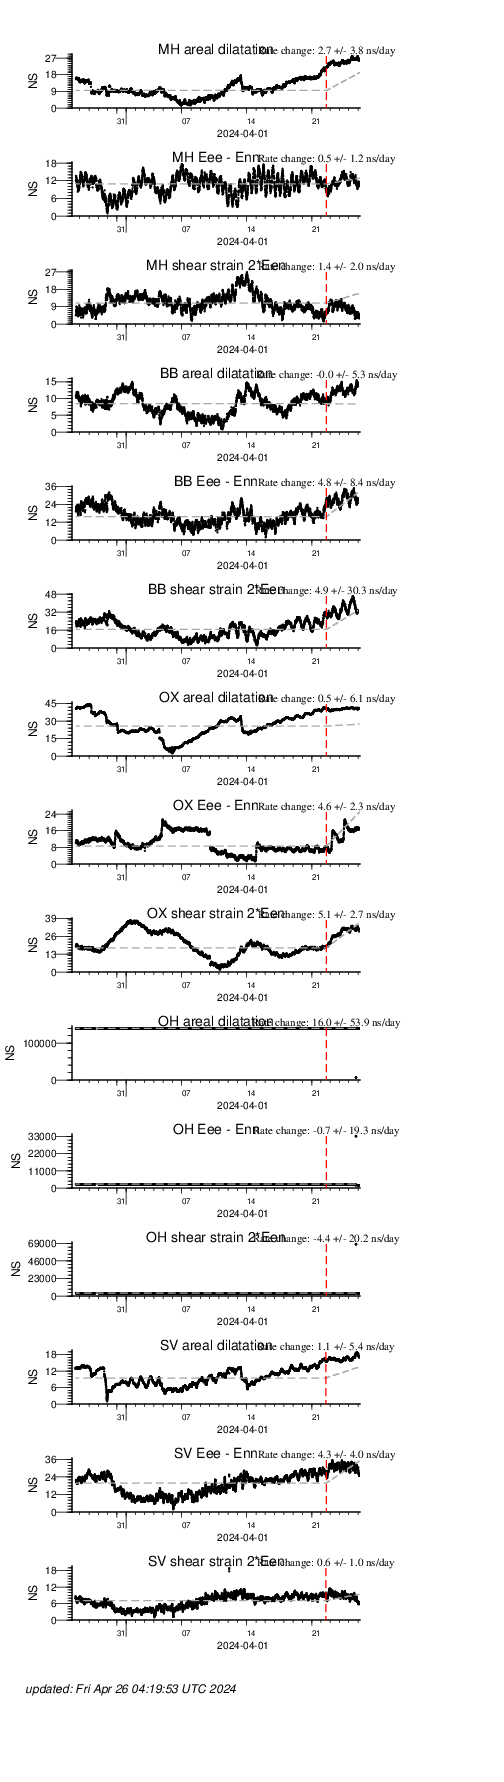
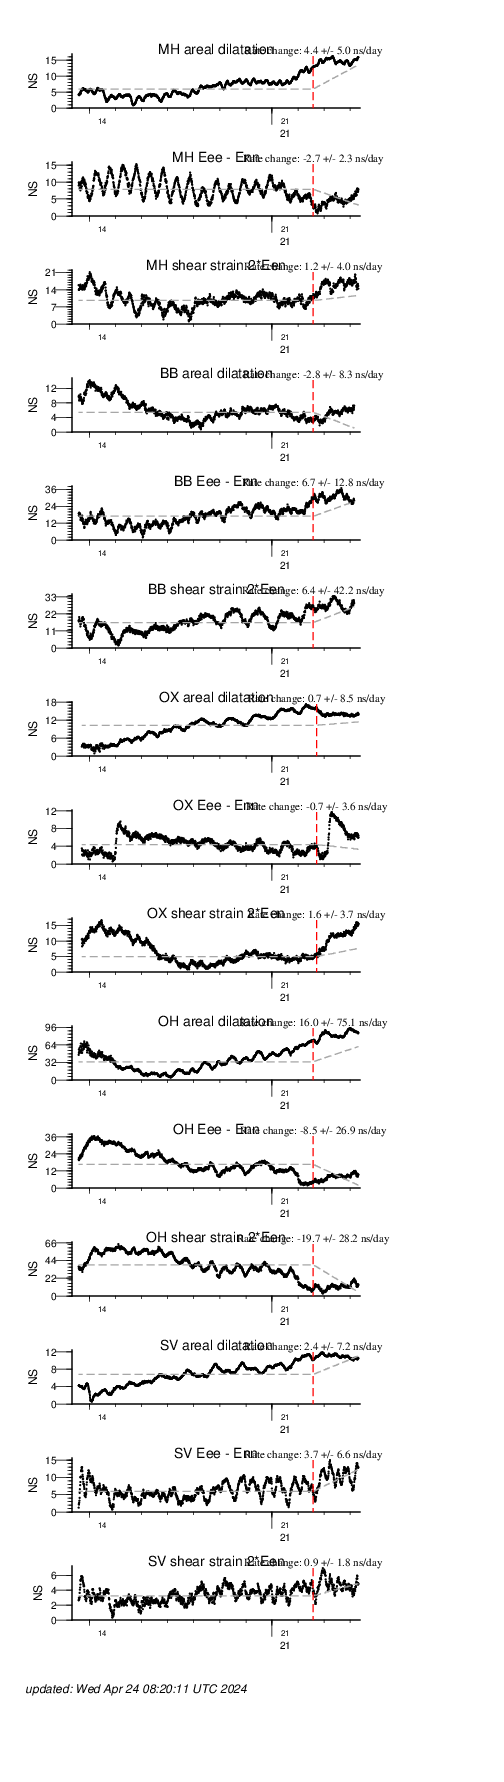
The goal is to evaluate the most recent data with previous data. This is done by estimating a rate of the current data and compare that with the rate of the previous data. In all of the plots of the data below, the change in rate, along with its standard error (1-sigma) is given. The residuals after removing the rate estimated for the previous data are plotted. For instance, if 100 days of data are evaluated, the current data is identified as the last 10 day while the previous data span the previous 90-day interval.
Summary of anomalies
The following summarizes the status of the suite of instruments monitoring the deformation across the SF Bay Area. Data are evaluated as follows:
- Last 10 days compared to a baseline from the previous 100 days
- Last 30 days compared to a baseline from the previous 2 years
- Last 90 days compared to a baseline from the previous 3 years
- Last 1 year compared to a baseline from the previous 10 years
If the number of time series for which a rate change is significant, the summary will list the anomalous time series; otherwise, the summary will state "no significant changes found".
10 days compared with previous 100 days
30 days compared with previous 2 years
90 days compared with previous 3 years
1 year compared with previous 10 years
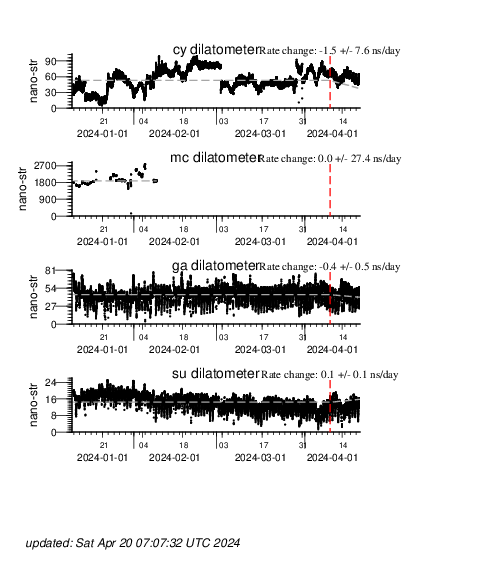
Caution should be exercised with the strain meter data as the data from these instruments as they are sensitive to rainfall. Although the strainmeter data are manually edited, the edits and adjustments are usually done "after the fact" such that telemetry problems and instrument resets can trigger an anomalous detection. This will only be apparent in the 10-day/100-day comparisons.
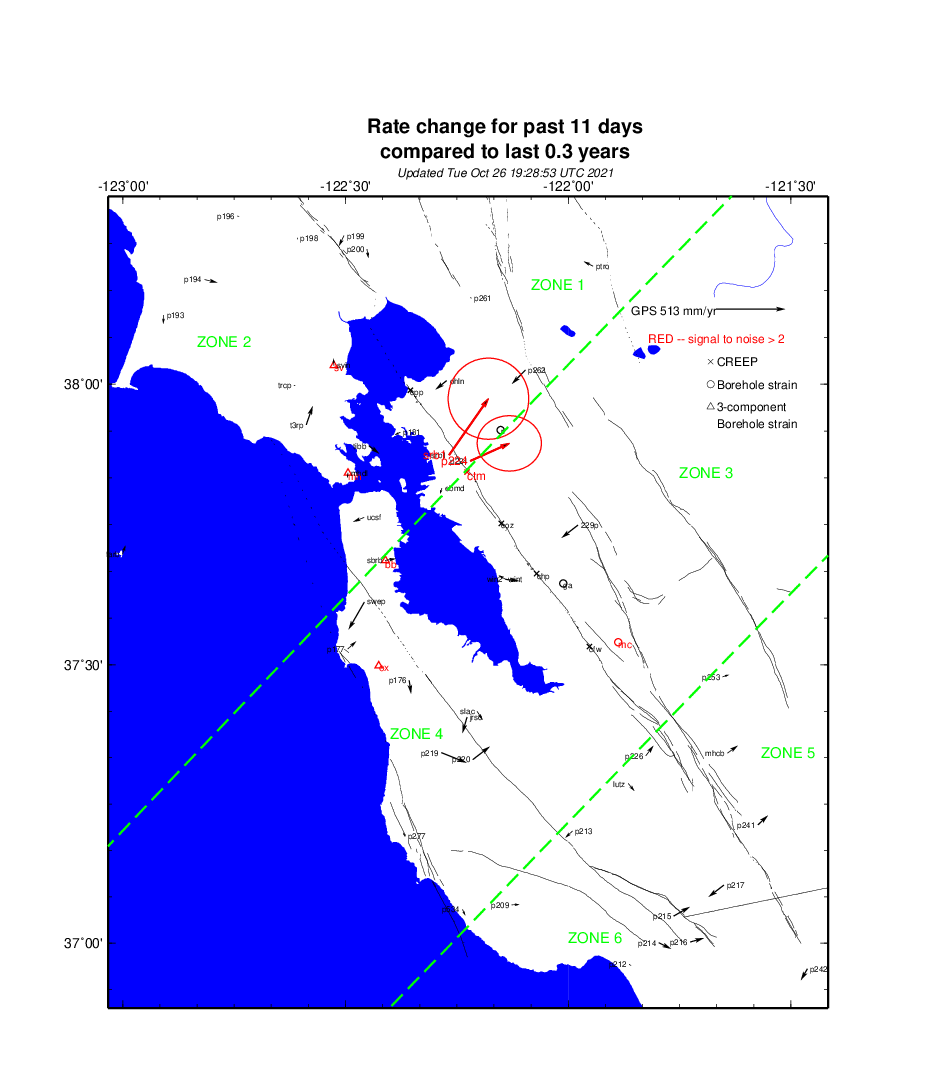
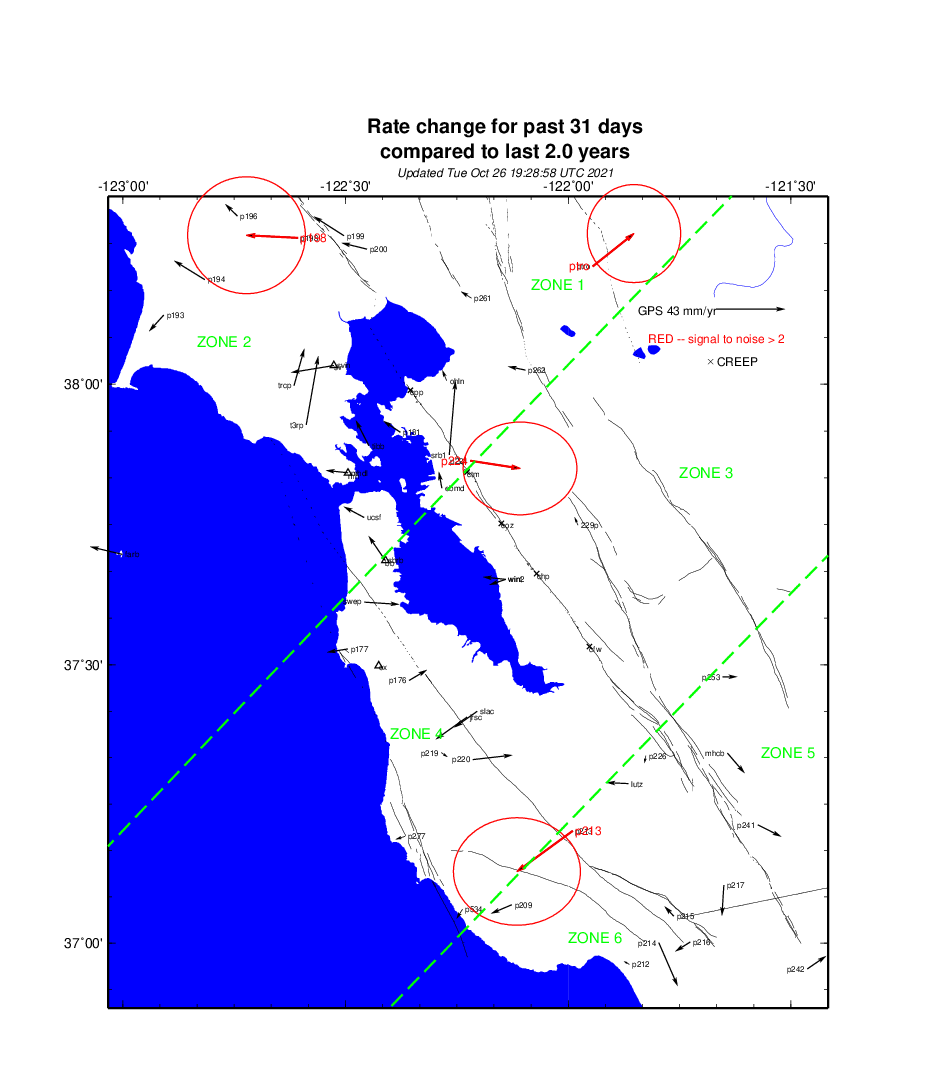
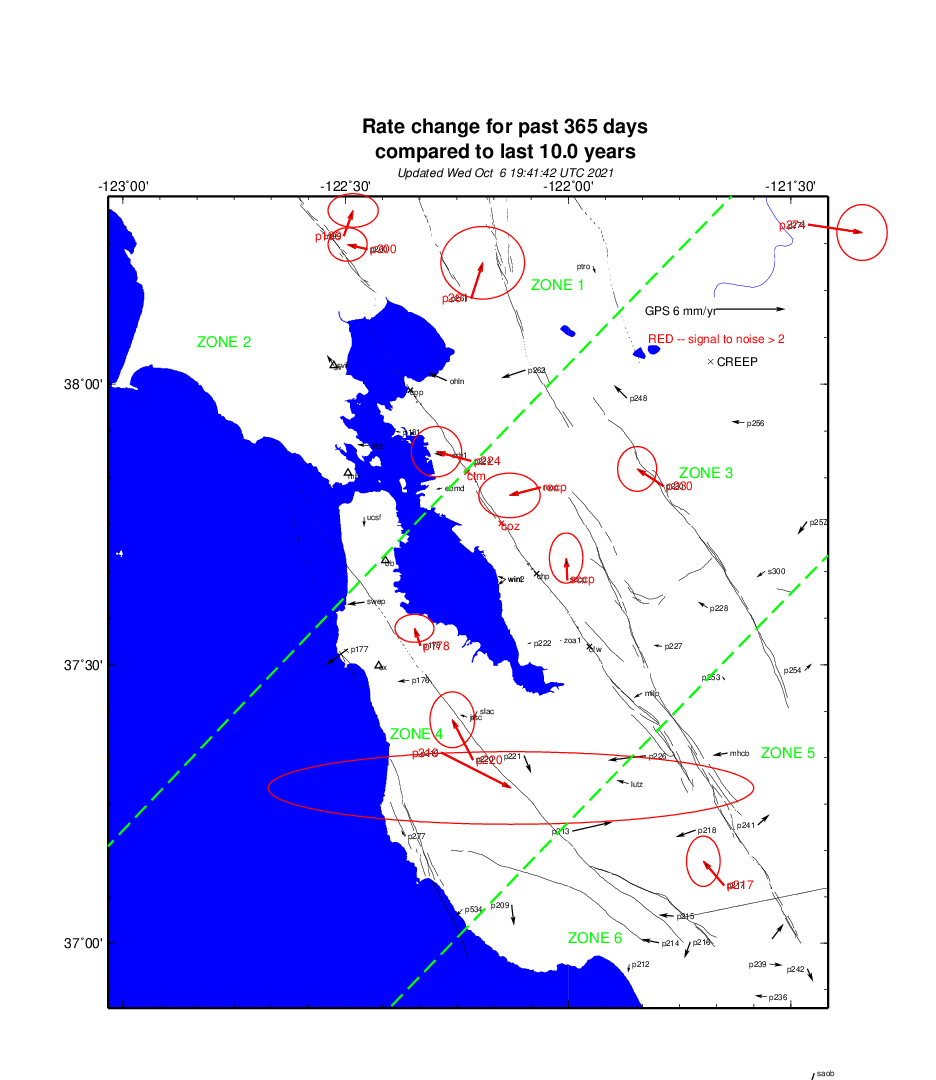
Spatial distribution of rate changes from Long-term monitoring data
The following maps show the locations of changes in the velocity of GPS sites, changes in creep rates, and, optionally, changes in strain rate from borehole strainmeters. Anything that is shown in Red represents a site where the signal (velocity, creep, or strain) is more than twice the standard error.
| Time span |
|---|
| last 10 days compared with previous 100 days |
| last 30 days compared with previous 2 years |
| last 90 days compared with previous 3 years |
| last 1 year compared with previous 10 years |
Long-term monitoring time-series data
| Instrument Network | Stack Plots; updated every third day | |||
|---|---|---|---|---|
| last 10 days compared with previous 100 days | last 30 days compared with previous 2 years | last 90 days compared with previous 3 years | last 1 year compared with previous 10 years | |
| Creepmeter | 10 days | 30 days | 90 days | 1 year |
| GPS --Zone 1 | 10 days | 30 days | 90 days | 1 year |
| GPS -- Zone 2 | 10 days | 30 days | 90 days | 1 year |
| GPS -- Zone 3 | 10 days | 30 days | 90 days | 1 year |
| GPS -- Zone 4 | 10 days | 30 days | 90 days | 1 year |
| GPS -- Zone 5 | 10 days | 30 days | 90 days | 1 year |
| GPS -- Zone 6 | 10 days | 30 days | 90 days | 1 year |
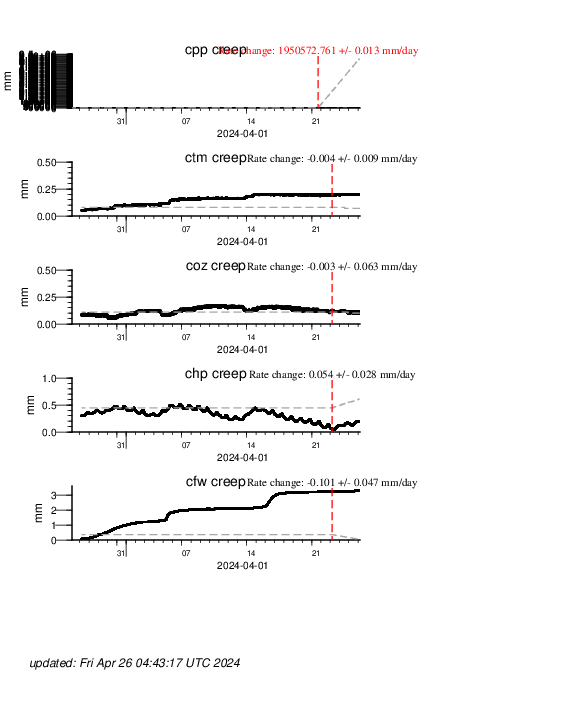
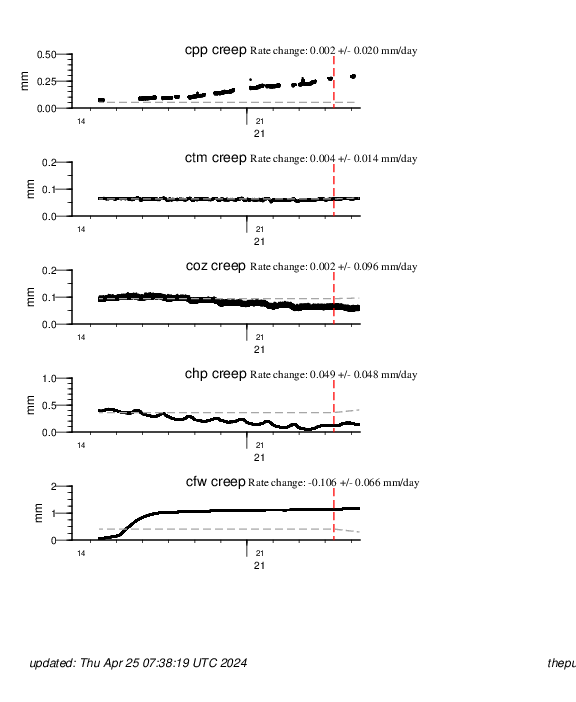
Short-term monitoring data
The presennt creep and strain data but, with the exception of the 10/100 day analysis, are not used not mixed or evaluated with the GPS. The short term monitoring is only presented as a reference.
| Instrument Network | Stack Plots; updated daily | ||
|---|---|---|---|
| last 10 days compared with previous 100 days | last 3 days compared with previous 30 days | last 1 day compared with previous 10 days | |
| Creepmeter | 10 days | 3 days | 1 day |
| Dilatometer | 10 days | 3 days | 1 day |
| Tensor strain | 10 days | 3 days | 1 day |
Updated, 20, March 2013
langbein at usgs dot gov