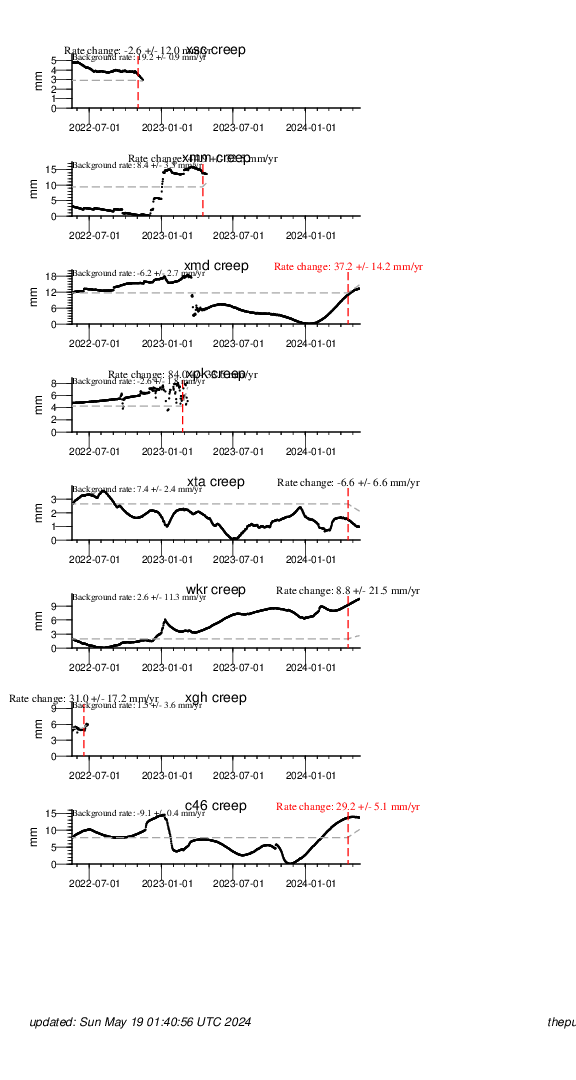
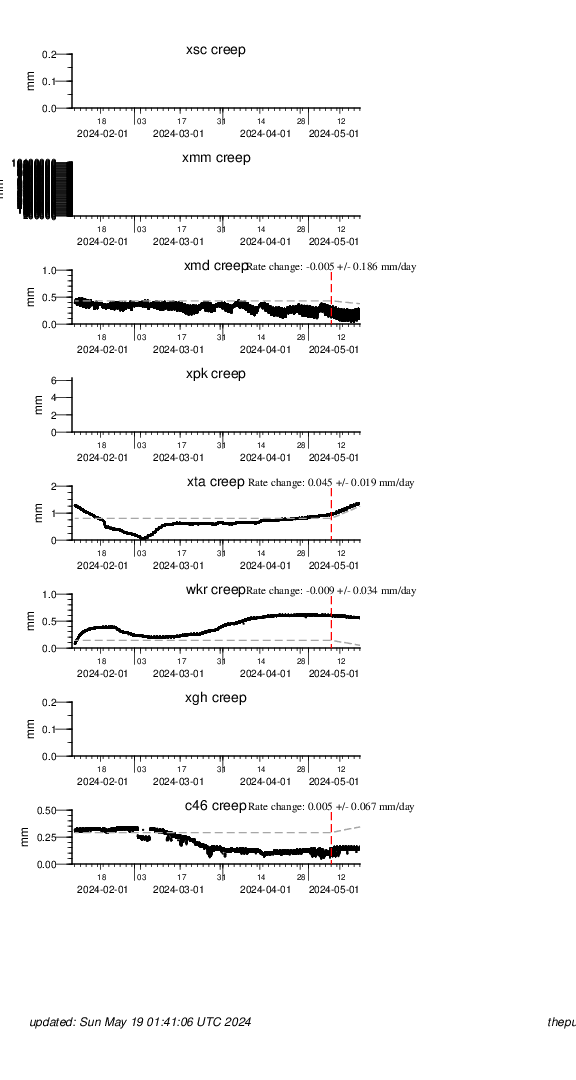
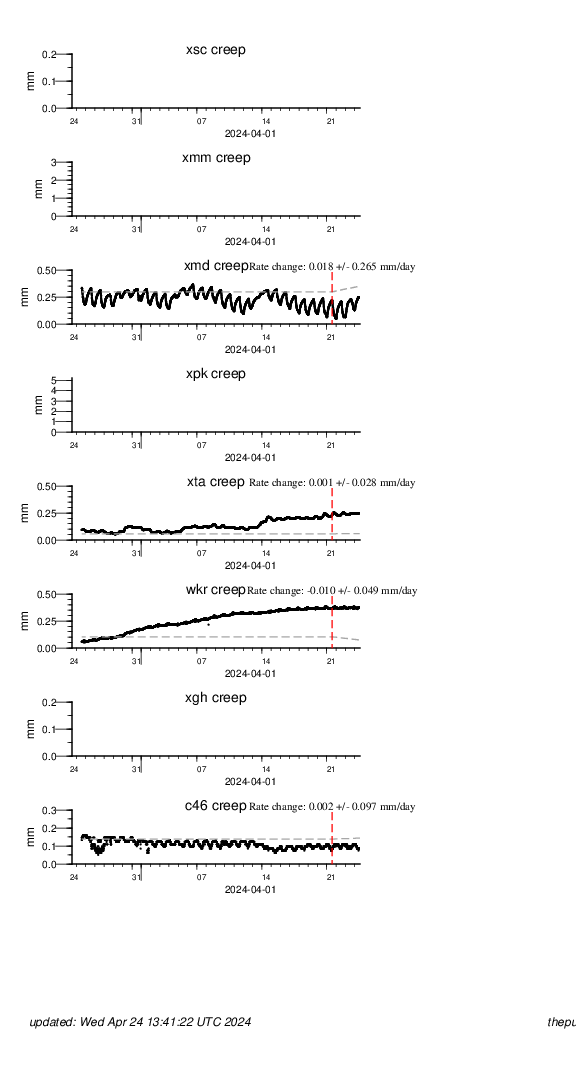
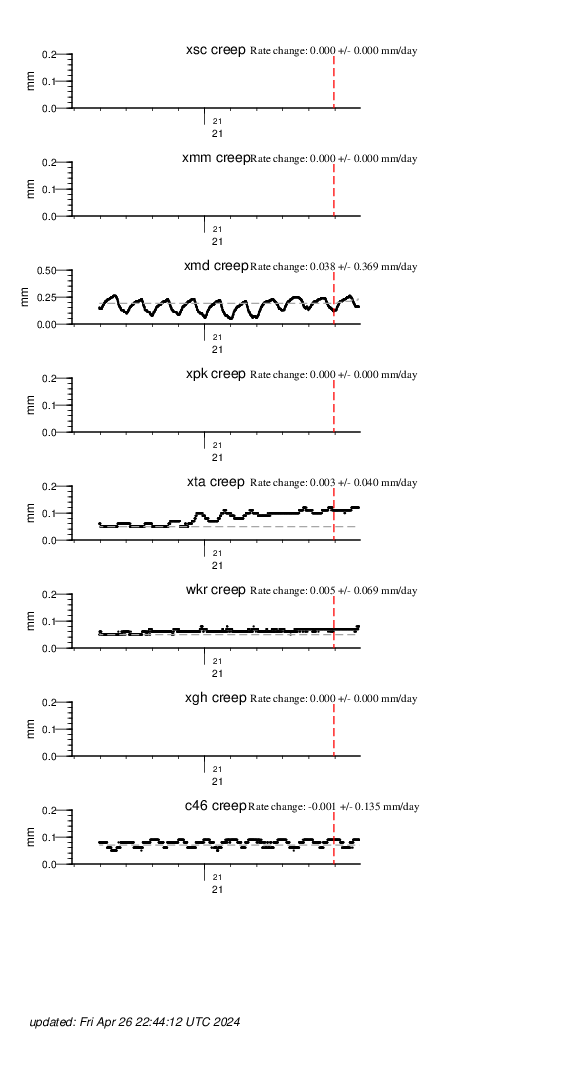
Rate Changes detected on Creepmeters in SF Bay and Central Calif.
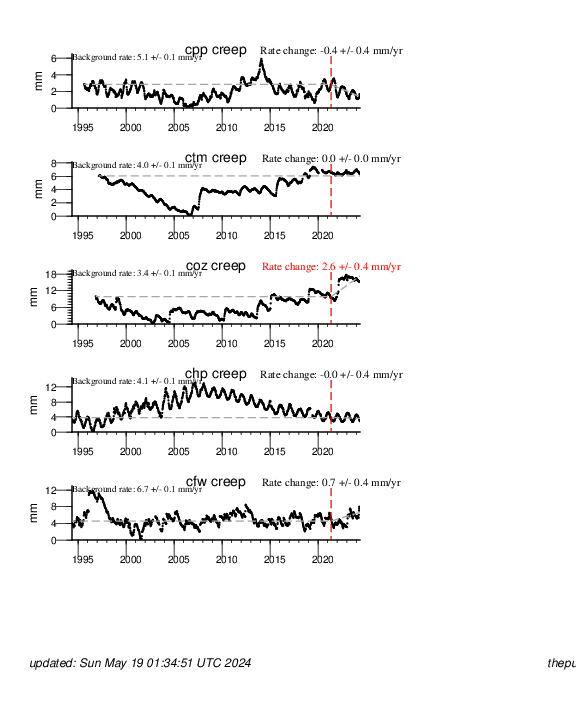
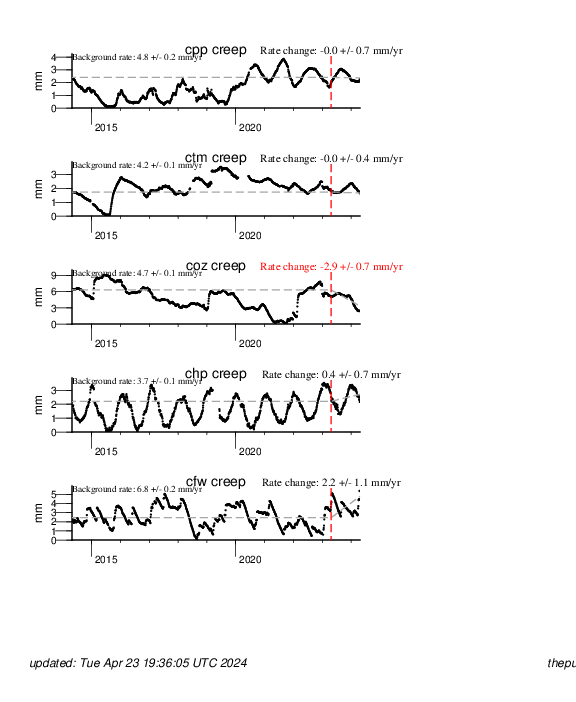
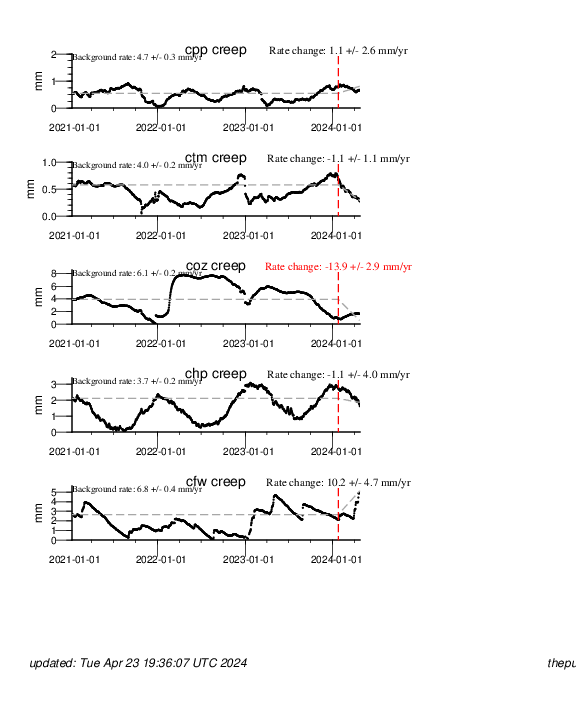
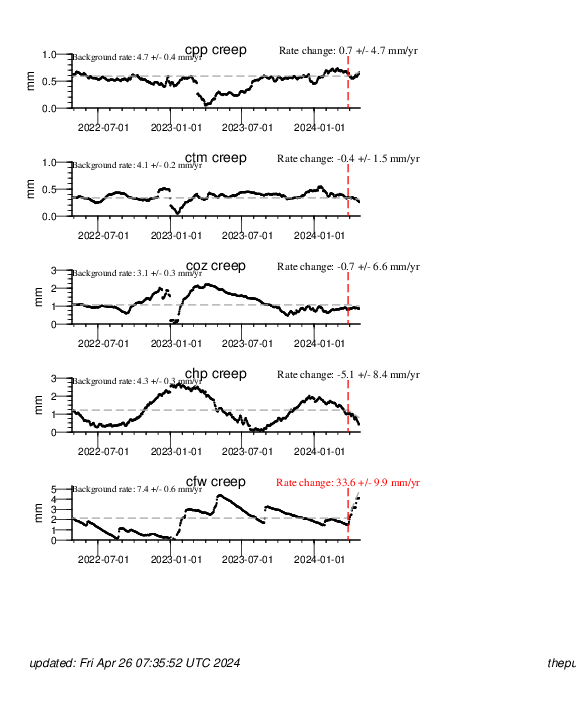
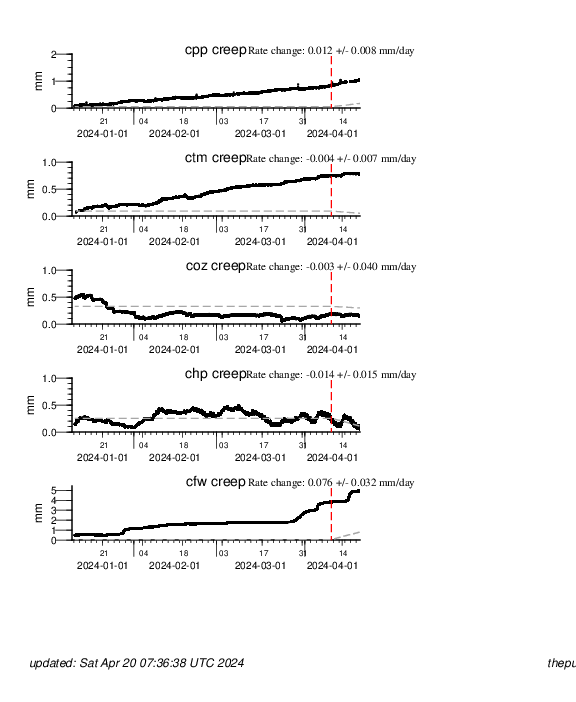
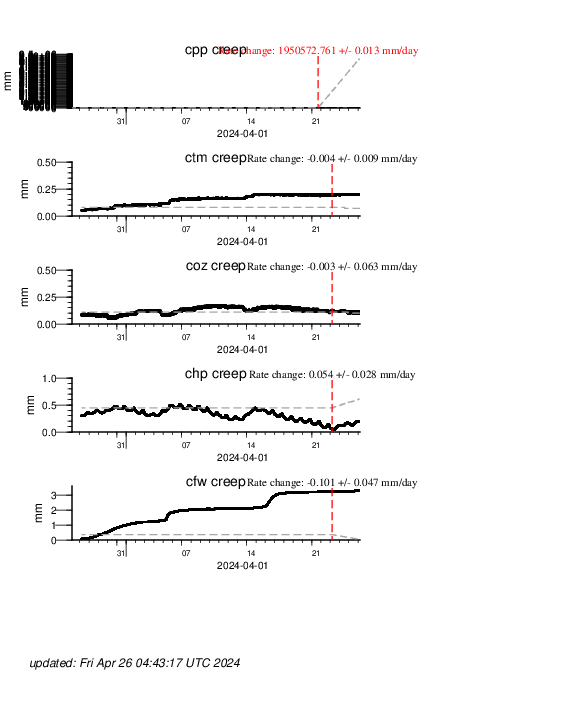
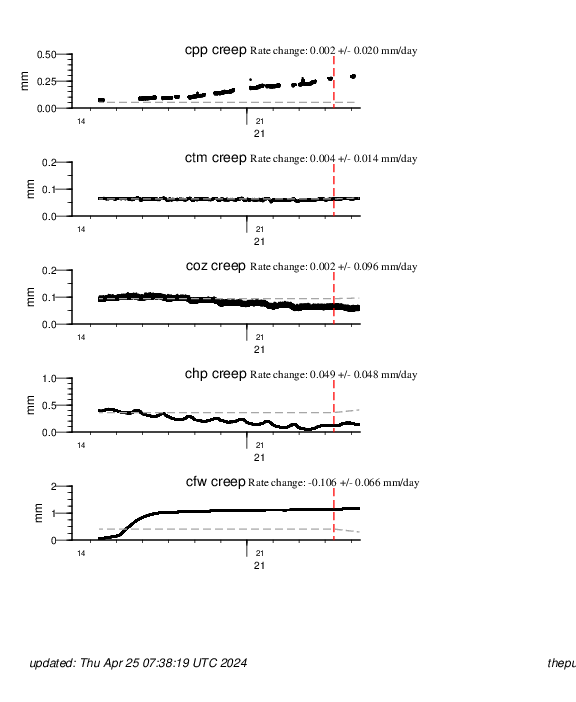
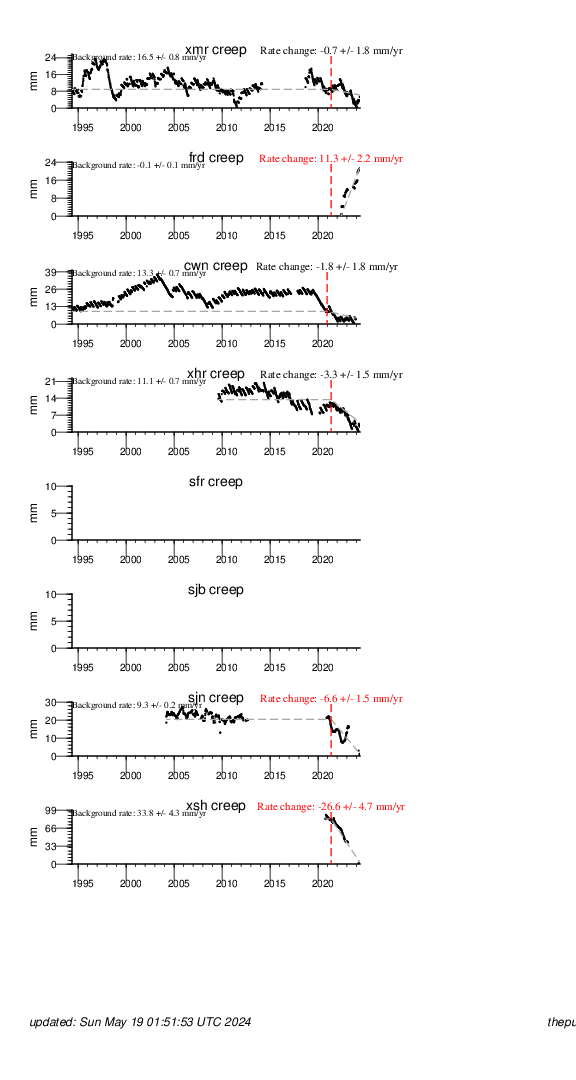
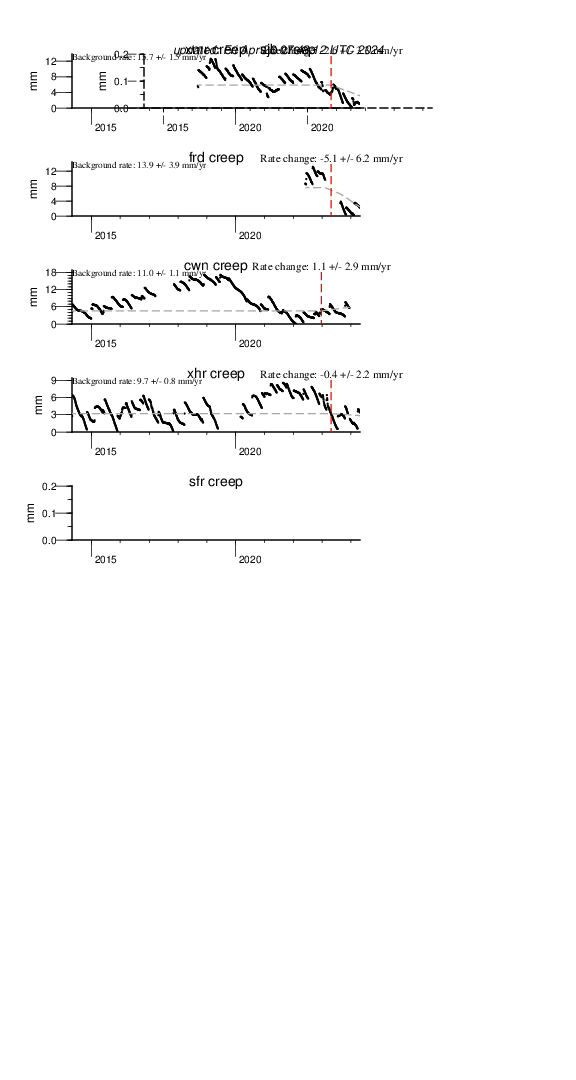
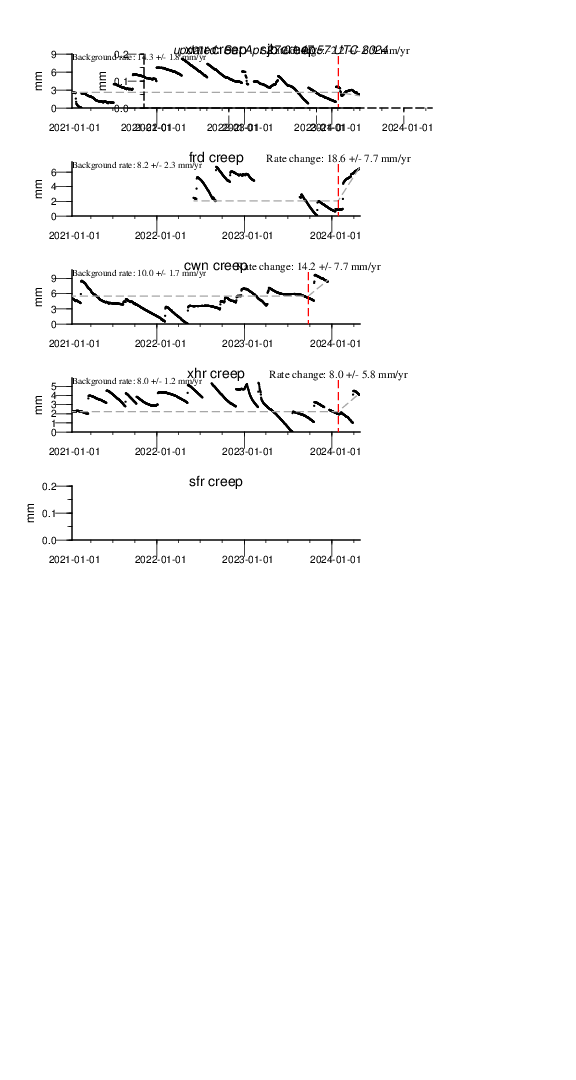
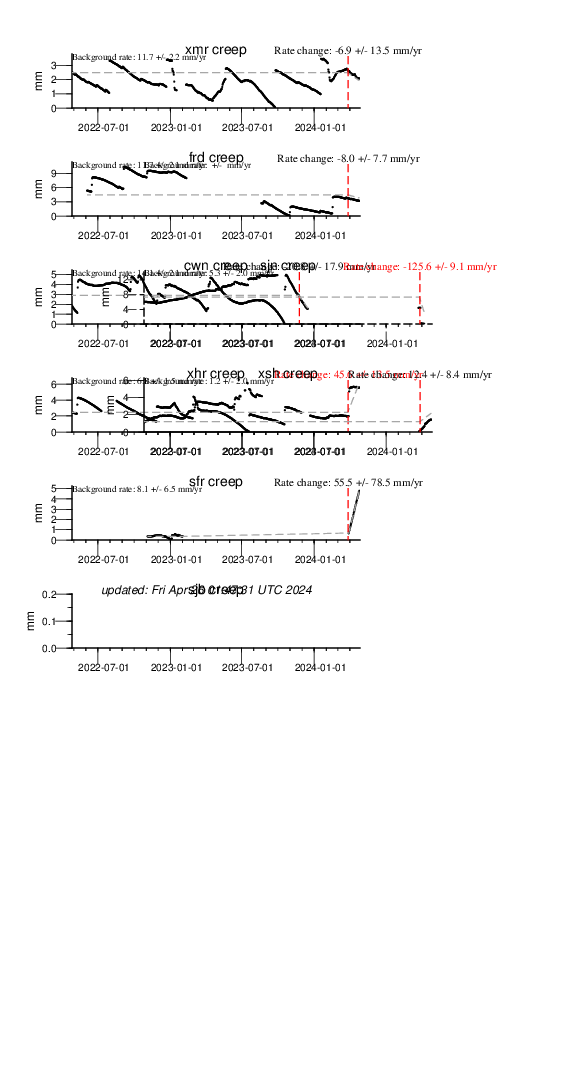
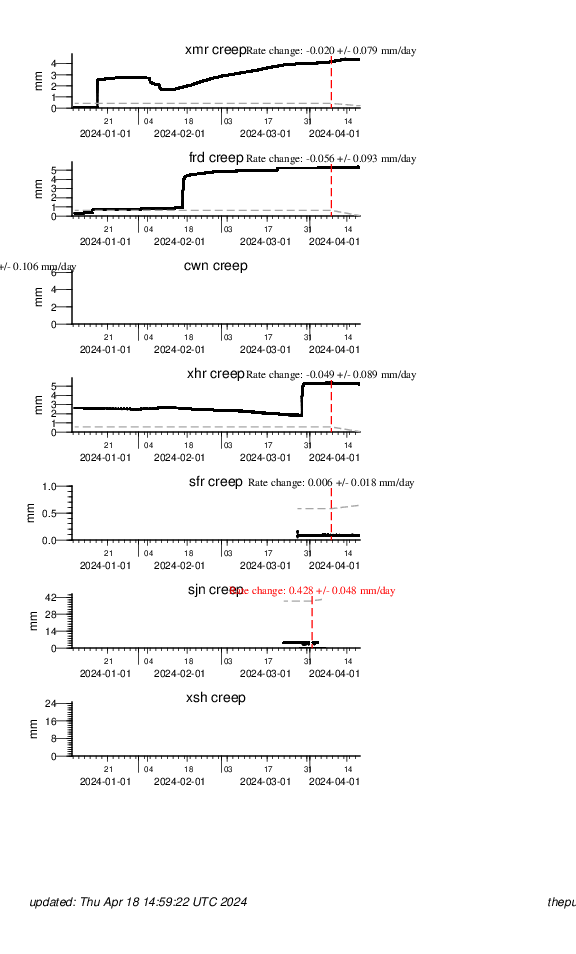
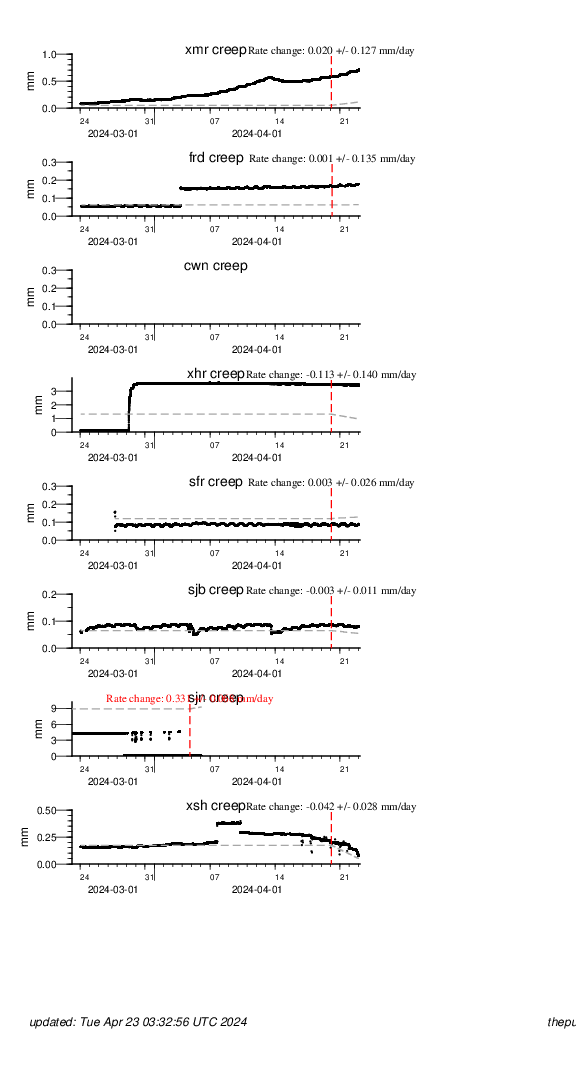
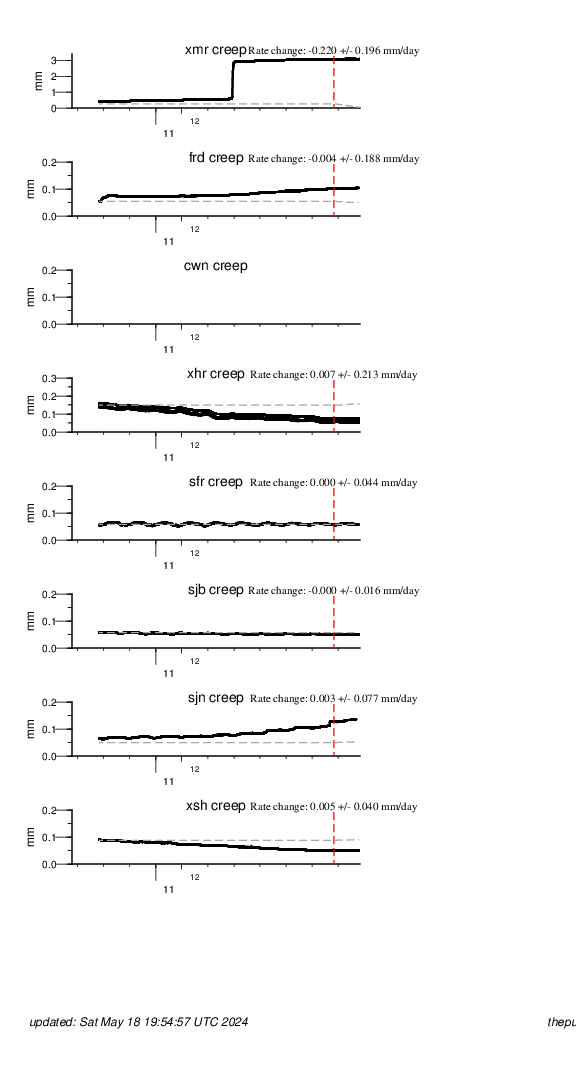
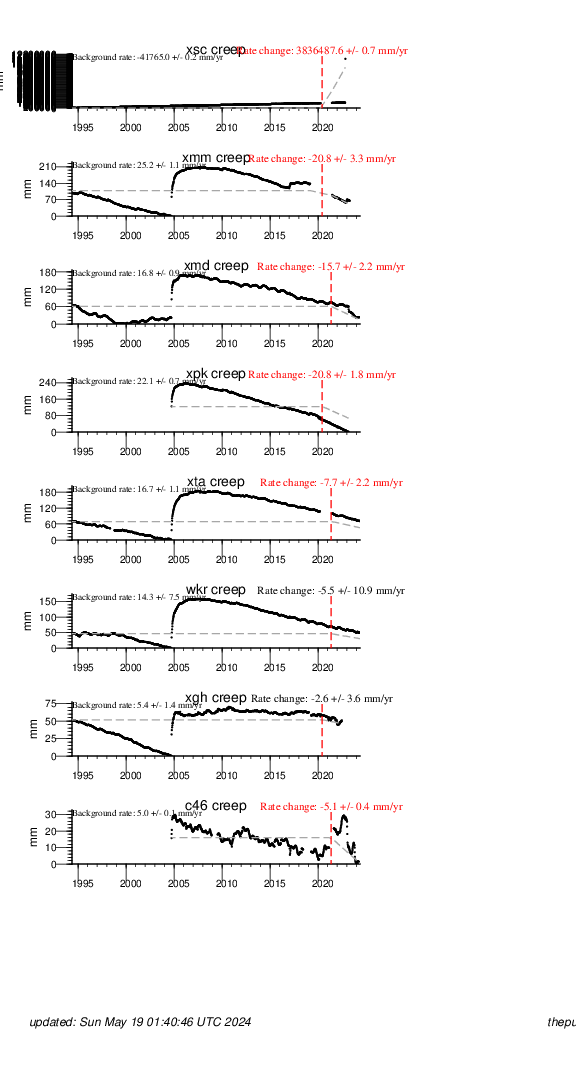
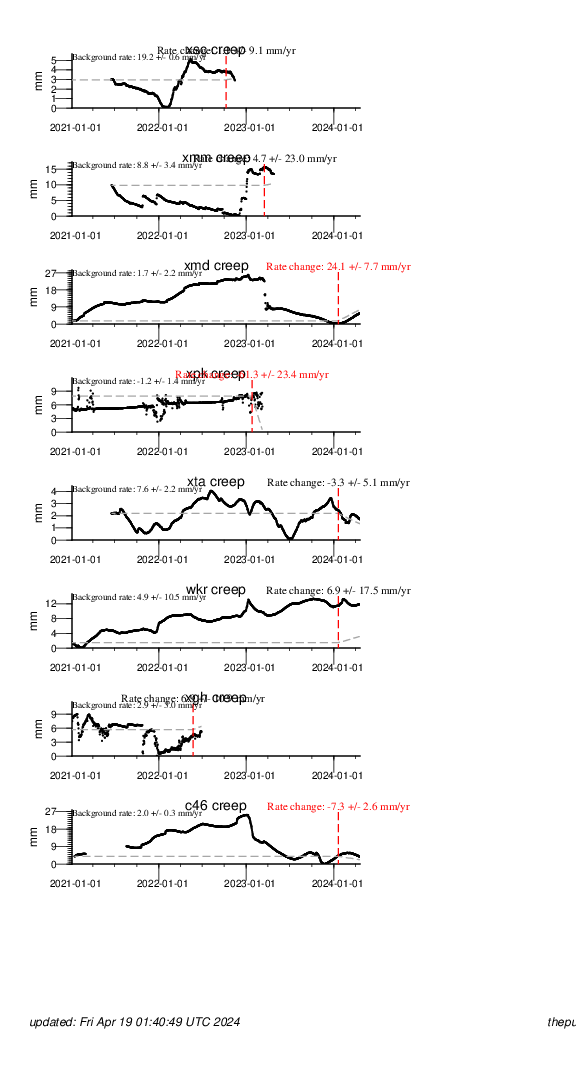
This page contains links to plots of strain data from the creepmeter network. The plots presented below explore rate changes in these data. Specifically, a period of data is selected for the previous 10 years, 3.2 years, 2 years, 100 days, previous 30 days, and previous 10 days; a rate is fit to the all of the data in those time intervals and, for the last 10% of the time series (1 year, 90 days, 60 days, 10 days, 3 days, and 1 day) a rate change is also fit. The estimated rate change is compared with its standard error. The plots are updated once per day through automated scripts.
| Region | Creepmeter Stack Plots | ||||||
|---|---|---|---|---|---|---|---|
| 30 years | 10 years | last 3.2 years | 2 years | last 100 days | last 30 days | last 10 days | |
| Hayward Fault -- San Francisco Bay | 30 years | 10 years | 3.2 years | 2 years | 100 days | 30 days | 10 days |
| San Juan Bautista/Hollister | 30 years | 10 years | 3.2 years | 2 years | 100 days | 30 days | 10 days |
| Parkfield | 30 years | 10 years | 3.2 years | 2 years | 100 days | 30 days | 10 days |
Follow this link for rupture meter data for the SF Bay area